October 17, 2025 a 04:28 am

GBPNZD: Trend and Support & Resistance Analysis
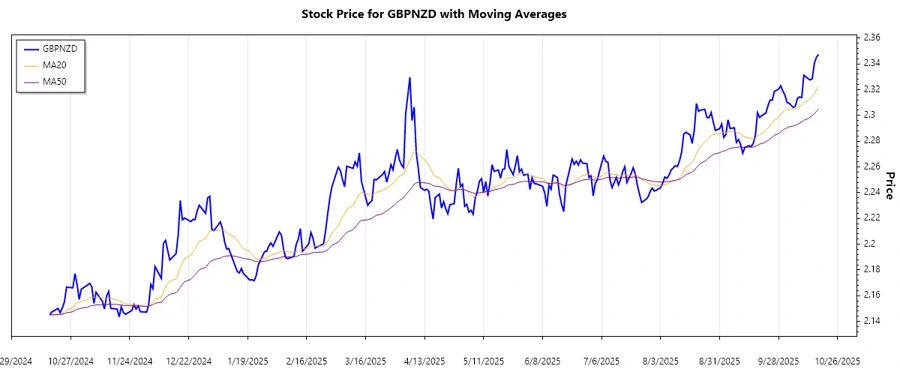
The GBPNZD currency pair has shown some interesting movements in recent months. Analyzing the data reveals notable trends, giving insight into the pair's performance. Our technical analysis draws from moving averages, identifying potential support and resistance levels. This provides valuable insights for trading strategies.
Trend Analysis
Based on the historical data, the calculation of the 20-day Exponential Moving Average (EMA20) and the 50-day Exponential Moving Average (EMA50) provides insights into the current trend of the GBPNZD currency pair. Recently, the EMA20 has crossed above the EMA50, indicating that the pair is currently in an upward trend. This suggests a recovery in the pair and may point towards a bullish sentiment in the market.
| Date | Close Price | Trend |
|---|---|---|
| 2025-10-17 | 2.34735 | ▲ |
| 2025-10-16 | 2.34522 | ▲ |
| 2025-10-15 | 2.34052 | ▲ |
| 2025-10-14 | 2.32848 | ▲ |
| 2025-10-13 | 2.32751 | ▲ |
| 2025-10-12 | 2.32856 | ▲ |
| 2025-10-10 | 2.33120 | ▲ |
This positive momentum can be interpreted as a bullish signal for traders, suggesting an opportunity to consider entering long positions or maintaining bullish strategies.
Support and Resistance
Analyzing the historical data, the following support and resistance zones have been identified. Prices typically bounce off these levels, and they can provide insight into potential future price movements.
| Type | From | To |
|---|---|---|
| Support Zone 1 | 2.2750 | ▲ 2.3000 |
| Support Zone 2 | 2.3100 | ▲ 2.3300 |
| Resistance Zone 1 | 2.3400 | ▼ 2.3500 |
| Resistance Zone 2 | 2.3600 | ▼ 2.3800 |
The current trading level is within the first resistance zone, suggesting that traders should watch closely for potential price reversals or breakouts.
Conclusion
The GBPNZD shows a notable upward trend, bolstered by the bullish crossover of EMA20 above EMA50. While trading inside the resistance zone, potential upside may be capped, although breakthroughs could offer new opportunities. However, traders should be cautious of potential fluctuations and consider risk management strategies. The stability around identified support zones provides a buffer for price falls, presenting favorable entry points for buying if the price retraces to these levels. Overall, continued monitoring is recommended to optimize trading decisions.
Smart Data Insight
Master the Perfect Entry & Exit for this Stock
Don't leave your profits to chance. Historically, this stock follows specific seasonal patterns that institutional traders use to maximize returns.
- ✅ Identify the "Golden Buying Window"
- ✅ Avoid high-risk correction cycles
- ✅ Backtested data from the last 20+ years