June 03, 2025 a 04:28 am
GBPNZD: Trend and Support & Resistance Analysis
The recent analysis of the GBPNZD currency pair reveals insights into its price behavior over the past months. By examining the moving averages and identifying support and resistance levels, an overview of the current market trend is formed. The data suggests a consistent pattern, driven significantly by macroeconomic factors affecting both the British Pound and the New Zealand Dollar. This analysis aids traders and investors in making informed decisions regarding the entry and exit points.
Trend Analysis
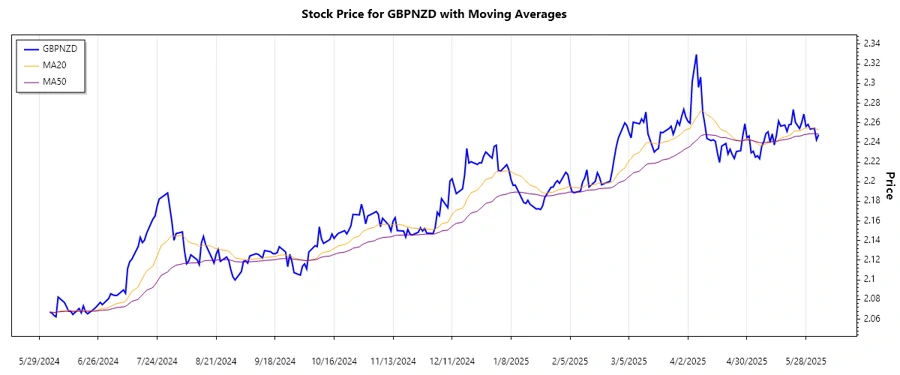
The trend analysis for GBPNZD shows an intriguing behavior over the last period. Calculating the exponential moving averages, EMA20 and EMA50, allows us to observe significant trends. The calculations reveal an ongoing trend pattern that traders should consider:
| Date | Closing Price | Trend |
|---|---|---|
| 2025-06-03 | 2.24772 | ▲ Upward |
| 2025-06-02 | 2.24252 | ▲ Upward |
| 2025-06-01 | 2.25440 | ▲ Upward |
| 2025-05-30 | 2.25347 | ▲ Upward |
| 2025-05-29 | 2.25828 | ▲ Upward |
| 2025-05-28 | 2.25624 | ▲ Upward |
| 2025-05-27 | 2.26883 | ▲ Upward |
Reviewing these moving averages, it is evident that the GBPNZD currency pair is currently in an upward trend, as noted by the EMA20 consistently remaining above the EMA50 line.
Support and Resistance
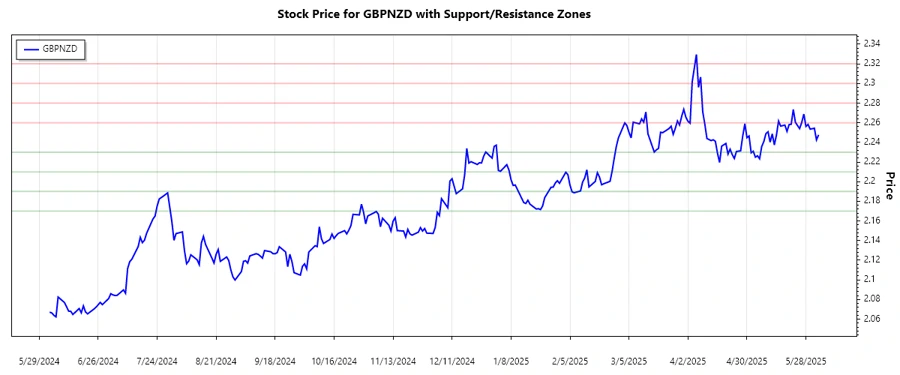
Identifying pivotal support and resistance zones gives a clearer picture of the market positioning. Based on the historical closing prices, the following zones have been identified:
| Zone Type | From | To |
|---|---|---|
| Support 1 | 2.2100 | 2.2300 |
| Support 2 | 2.1700 | 2.1900 |
| Resistance 1 | 2.2600 | 2.2800 |
| Resistance 2 | 2.3000 | 2.3200 |
Currently, the GBPNZD pair is trading well above its critical support zones, nearing a resistance zone. This proximity to a resistance level indicates potential consolidation or reversal in trend if breached convincingly.
Conclusion
The analysis of GBPNZD indicates a persistent uptrend, which has persisted over the analyzed period. The currency pair's position near the resistance zone suggests possible resistance tests, which traders should monitor closely. Overall, continued upward movement could be expected if closing prices breach the current resistance level significantly. However, risk factors could disrupt this trajectory, requiring investors to remain vigilant. The technical indicators provide a robust framework for making informed investment choices.
Smart Data Insight
Master the Perfect Entry & Exit for this Stock
Don't leave your profits to chance. Historically, this stock follows specific seasonal patterns that institutional traders use to maximize returns.
- ✅ Identify the "Golden Buying Window"
- ✅ Avoid high-risk correction cycles
- ✅ Backtested data from the last 20+ years