
July 27, 2026 a 05:08 am
GBPNZD: Fibonacci Analysis
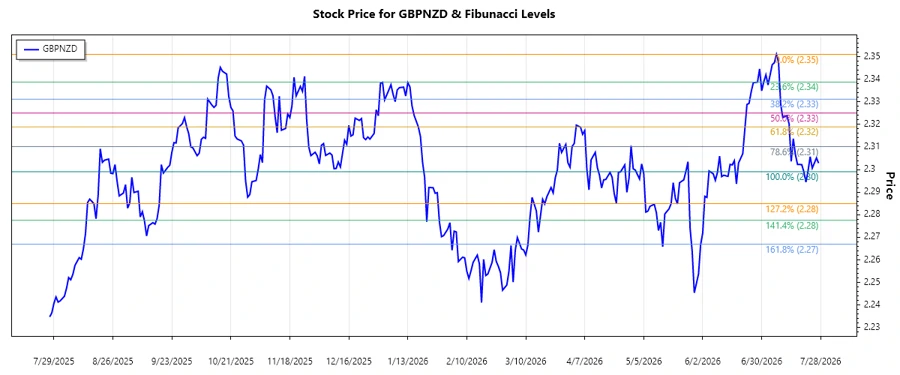
The GBPNZD currency pair has shown a mixture of volatility and trend stability over the past months. Intense market fluctuations are prevalent, influenced by significant economic updates from both the UK and New Zealand. The dominant trend identified suggests that the currency pair is currently experiencing a downward trajectory, influenced by consistent lower lows. As we dive deeper into the Fibonacci analysis, a clearer picture of potential support and resistance levels should emerge.
Fibonacci Analysis
The downward trend started in early July 2026 and continued until late July 2026. The highest price recorded during this period was 2.35098 on 2026-07-07, and the lowest price was 2.29903 on 2026-07-20. Based on these figures, the following Fibonacci Retracement Levels have been calculated:
| Level | Price |
|---|---|
| 0.236 | 2.31664 |
| 0.382 | 2.32560 |
| 0.5 | 2.32501 |
| 0.618 | 2.33470 |
| 0.786 | 2.34596 |
Currently, the price is at 2.30284, indicating it is below the lowest Fibonacci level of 0.236 and not residing within any retracement zone.
This suggests possible further weakness for the GBPNZD, with no immediate technical supports at the identified Fibonacci levels.
Conclusion
The technical outlook for GBPNZD remains bearish in light of the recent data analysis. If the currency pair continues below the 0.236 Fibonacci Retracement Level, additional declines may ensue until significant price support is found. However, should a reversal occur with momentum, there's potential for testing resistance at higher Fibonacci levels. Traders should be cautious and keep a close watch on key economic indicators from the UK and New Zealand, as these can catalyze swift market movements.
Smart Data Insight
Master the Perfect Entry & Exit for this Stock
Don't leave your profits to chance. Historically, this stock follows specific seasonal patterns that institutional traders use to maximize returns.
- ✅ Identify the "Golden Buying Window"
- ✅ Avoid high-risk correction cycles
- ✅ Backtested data from the last 20+ years