November 22, 2025 a 05:08 am

GBPNZD: Fibonacci Analysis
The GBPNZD pair has shown significant trends over the last few months. This analysis reveals a prevailing upward trend driven by economic factors in the UK. As investors look for safe currency bets amid global instability, the GBPNZD might continue to present opportunities.
Fibonacci Analysis
This analysis focuses on the recent upward trend in the GBPNZD currency pair, identifying key Fibonacci retracement levels that traders should watch closely.
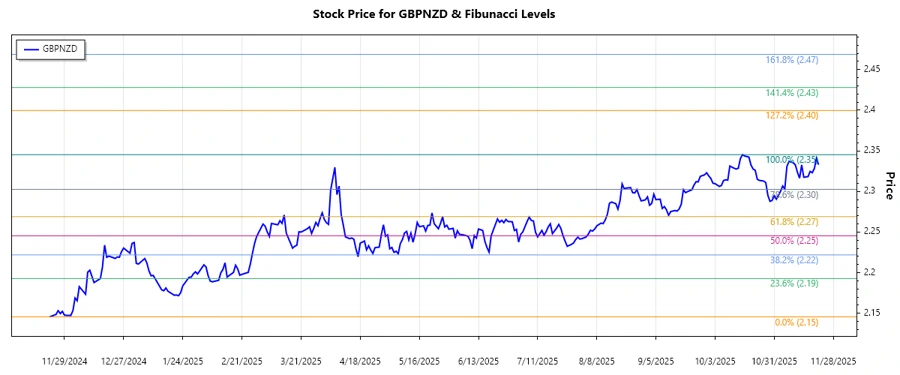
| Period | High | Low |
|---|---|---|
| 2024-11-22 to 2025-11-21 | 2.34522 (2025-10-16) | 2.14554 (2024-11-22) |
| Fibonacci Level | Price |
|---|---|
| 0.236 | 2.19443 |
| 0.382 | 2.22620 |
| 0.5 | 2.24538 |
| 0.618 | 2.26456 |
| 0.786 | 2.29533 |
The current price is within the 0.236 retracement level, indicating potential for further correction before resuming the upward trend.
Technical interpretation suggests a potential support area around the 0.236 level, which may stabilize the price before potential upward movement resumes.
Conclusion
The GBPNZD pair's current position within a retracement zone provides both opportunities and risks for traders. While the current support at the 0.236 level could lead to further upward momentum, a breakdown below this support may signal a deeper correction. Investors should stay alert for any economic news that could impact these levels. This analysis serves as a guide for watching potential reversal signals, which can optimize trade entry or exit points.
Smart Data Insight
Master the Perfect Entry & Exit for this Stock
Don't leave your profits to chance. Historically, this stock follows specific seasonal patterns that institutional traders use to maximize returns.
- ✅ Identify the "Golden Buying Window"
- ✅ Avoid high-risk correction cycles
- ✅ Backtested data from the last 20+ years