
June 29, 2026 a 04:28 am

GBPJPY: Trend and Support & Resistance Analysis
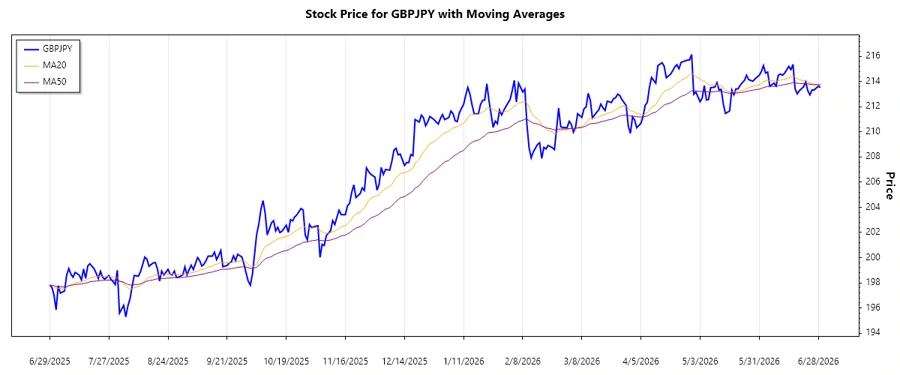
The GBPJPY currency pair has shown a recent tendency towards a sideways movement, as reflected by the convergence of the EMA20 and EMA50. However, it's essential to watch for any breakouts from identified support and resistance levels, which may indicate a renewed trend. The importance of analyzing the trend correctly cannot be understated, especially in such volatile market conditions.
Trend Analysis
The GBPJPY has been relatively stable during the analyzed period with prices oscillating in a tight range. This stability is highlighted by the almost flat EMAs.
| Date | Close Price | Trend |
|---|---|---|
| 2026-06-29 | 213.53 | ⚖️ |
| 2026-06-28 | 213.627 | ⚖️ |
| 2026-06-26 | 213.333 | ⚖️ |
| 2026-06-25 | 213.327 | ⚖️ |
| 2026-06-24 | 212.94 | ⚖️ |
| 2026-06-23 | 213.274 | ⚖️ |
| 2026-06-22 | 213.976 | ⚖️ |
The sideways trend suggests a period of consolidation, and a breakout is necessary to confirm the direction.
Support- and Resistance
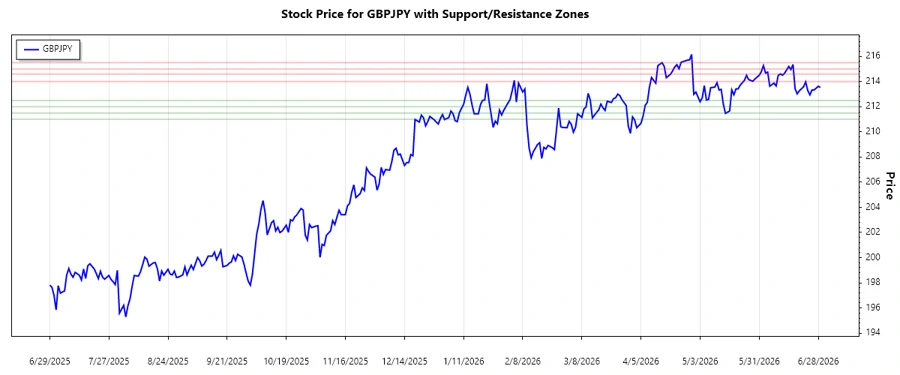
Support and resistance levels have played a crucial role in recent price movements. Two support and resistance zones provide traders with key levels to monitor.
| Type | From | To |
|---|---|---|
| Resistance 1 | 214.00 | 214.60 |
| Resistance 2 | 215.00 | 215.50 |
| Support 1 | 212.00 | 212.50 |
| Support 2 | 211.00 | 211.50 |
The current price is at the higher boundary of the support zone, showing potential for either bounce back to resistance or breakdown for a lower trend.
Conclusion
The GBPJPY currency pair is currently in a consolidation phase, awaiting a breakout for the next trend direction. Analysts should keep their eyes on the support and resistance zones. The closeness of these levels highlights the pair’s current lack of directional commitment, but also offers potential opportunities for range trading. Caution is advised, and implementing stop-loss orders might be prudent for risk management.
json This structure provides clarity on short-term technical indicators while allowing for seamless integration into a broader page.
Smart Data Insight
Master the Perfect Entry & Exit for this Stock
Don't leave your profits to chance. Historically, this stock follows specific seasonal patterns that institutional traders use to maximize returns.
- ✅ Identify the "Golden Buying Window"
- ✅ Avoid high-risk correction cycles
- ✅ Backtested data from the last 20+ years