May 10, 2026 a 04:28 am
GBPJPY: Trend and Support & Resistance Analysis
The GBPJPY currency pair has shown significant movements over the past months, exhibiting both upward and downward trends. The current analysis aims to assess the latest trends, along with support and resistance zones, providing insights into potential future movements. Traders should consider economic factors impacting both the British pound and the Japanese yen to better grasp the pair's potential trajectory.
Trend Analysis
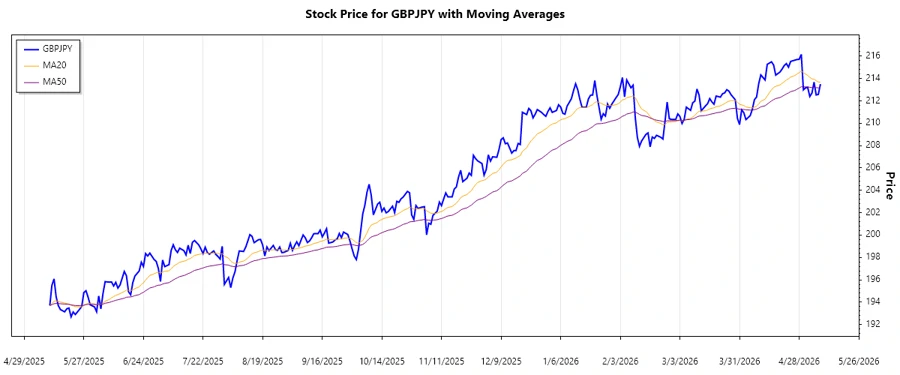
Based on the historical data and moving average calculations, we see notable trends in the GBPJPY currency pair. The recent fluctuation shows that the 20-day EMA is marginally below the 50-day EMA, indicating a slight downward trend.
| Date | Closing Price | Trend |
|---|---|---|
| 2026-05-08 | 213.508 | ⬇️ |
| 2026-05-07 | 212.579 | ⬇️ |
| 2026-05-06 | 212.532 | ⬇️ |
| 2026-05-05 | 213.677 | ⬆️ |
| 2026-05-04 | 212.699 | ⬇️ |
| 2026-05-03 | 212.393 | ⬇️ |
| 2026-05-02 | 213.21201 | ⬆️ |
The recent data illustrates frequent shifts between upward and downward trends, indicating market uncertainty. The consistent position of EMA20 below EMA50 strengthens the current bear sentiments.
Support and Resistance
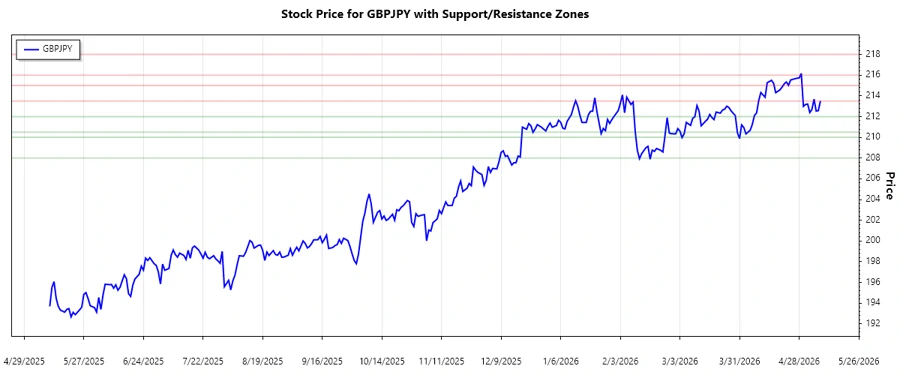
Using historical price data, we have calculated the current support and resistance zones for the GBPJPY pair.
| Zone | From | To |
|---|---|---|
| Resistance 1 | 213.50 | 215.00 |
| Resistance 2 | 216.00 | 218.00 |
| Support 1 | 210.50 | 212.00 |
| Support 2 | 208.00 | 210.00 |
Currently, the GBPJPY is trading within the support zone of 213.50 to 215.00, indicating a test of this level as potential upward movement resistance.
Conclusion
The GBPJPY exhibits a mild bearish trend, as indicated by the EMA calculations. Despite current trades within a support/resistance zone, the market remains clouded with uncertainty. Careful attention to macroeconomic indicators for both the UK and Japan will be crucial in anticipating future movements. Potential upward breaks from support levels could signal buying opportunities, while failures to break resistance could favor short positions. Analysts should remain vigilant due to the recent volatility and shifts in market sentiment.
Smart Data Insight
Master the Perfect Entry & Exit for this Stock
Don't leave your profits to chance. Historically, this stock follows specific seasonal patterns that institutional traders use to maximize returns.
- ✅ Identify the "Golden Buying Window"
- ✅ Avoid high-risk correction cycles
- ✅ Backtested data from the last 20+ years