January 17, 2026 a 04:28 am

GBPJPY: Trend and Support & Resistance Analysis
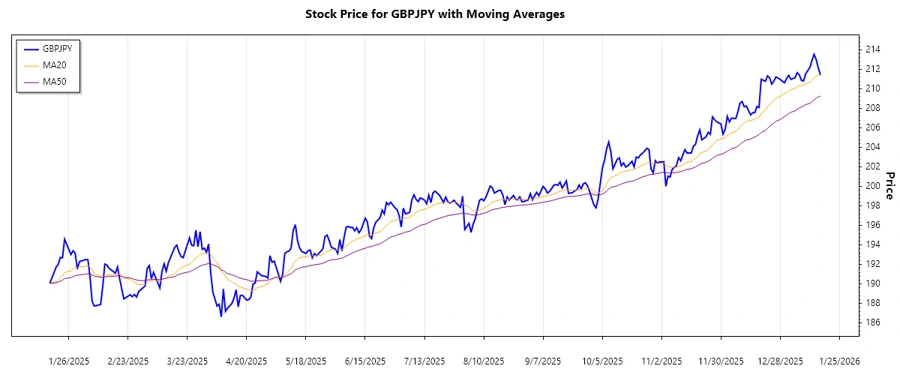
The GBPJPY currency pair has demonstrated a notable uptrend over the past few months, elevating from a low in mid-2025 to recent highs. Technical indicators such as the EMA are pivotal for understanding potential future price movements. A close analysis of support and resistance levels also sheds light on critical price points essential for trading decisions.
Trend Analysis
| Date | Closing Price | Trend |
|---|---|---|
| 2026-01-16 | 211.433 | ▲ |
| 2026-01-15 | 212.138 | ▲ |
| 2026-01-14 | 212.997 | ▲ |
| 2026-01-13 | 213.533 | ▲ |
| 2026-01-12 | 212.906 | ▲ |
| 2026-01-11 | 212.191 | ▲ |
| 2026-01-09 | 211.535 | ▲ |
The EMA20 is currently above the EMA50, indicating a strong upward trend in the GBPJPY pair. This suggests bullish sentiment among traders.
Support and Resistance
| Zone | From | To |
|---|---|---|
| Support Zone 1 | 208.00 | 210.00 |
| Support Zone 2 | 205.00 | 207.00 |
| Resistance Zone 1 | 212.00 | 214.00 |
| Resistance Zone 2 | 215.00 | 217.00 |
The current price resides near the upper boundary of the first resistance zone, suggesting potential retracement if the zone holds.
Conclusion
The GBPJPY pair is exhibiting a robust uptrend, reflecting positive market sentiment. However, as the price approaches resistance levels, caution must be exercised due to the possibility of a pullback. Investors should consider the potential for both continuous gains and temporary setbacks. Successfully navigating these conditions relies on observing key technical indicators and trading within identified support and resistance boundaries.