October 12, 2025 a 04:28 am
GBPJPY: Trend and Support & Resistance Analysis
The GBPJPY currency pair has exhibited notable fluctuations over the past months. Recently, it is showing signs of a recovery from previous lows, possibly indicating a new bullish phase. Having identified critical support and resistance zones, traders can navigate their strategies with a clearer perspective. Close monitoring of these levels can offer valuable insights for trading decisions.
Trend Analysis
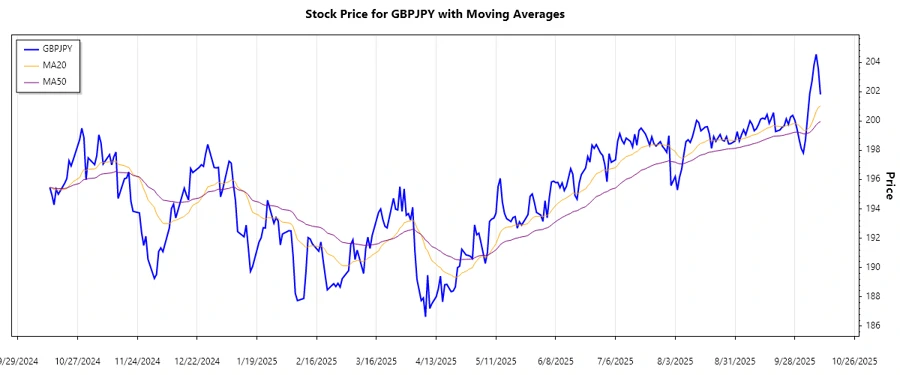
The current data analysis reveals that GBPJPY experienced fluctuations, with recent data showing a potential shift towards recovery. Calculations of EMA20 and EMA50 help to gauge this trend accurately:
| Date | Closing Price | Trend |
|---|---|---|
| 2025-10-10 | 201.808 | ▲ Uptrend |
| 2025-10-09 | 203.559 | ▲ Uptrend |
| 2025-10-08 | 204.54 | ▲ Uptrend |
| 2025-10-07 | 203.827 | ▲ Uptrend |
| 2025-10-06 | 202.672 | ▲ Uptrend |
| 2025-10-05 | 201.877 | ▲ Uptrend |
| 2025-10-03 | 198.72 | ▼ Downtrend |
The EMA20 being higher than the EMA50 indicates an emerging uptrend, suggesting a potential increase in value. This shift could be a profitable entry point for traders looking for an upwards move.
Support and Resistance
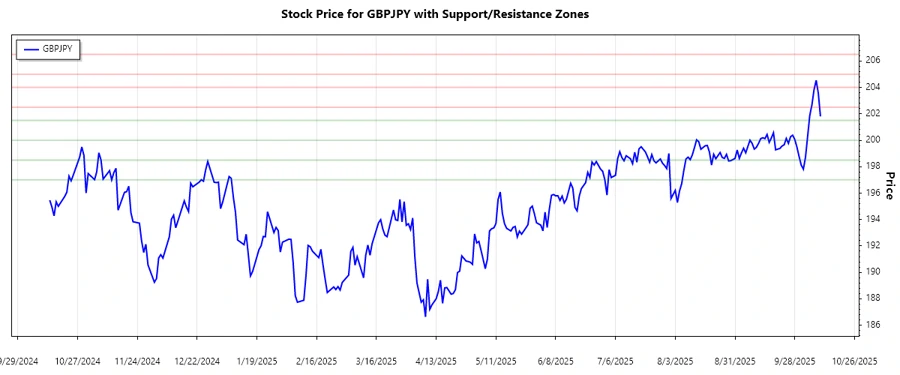
Based on the recent data analysis, important support and resistance zones have been identified:
| Zone | Price Range |
|---|---|
| Support Zone 1 | 197.000 - 198.500 |
| Support Zone 2 | 200.000 - 201.500 |
| Resistance Zone 1 | 202.500 - 204.000 |
| Resistance Zone 2 | 205.000 - 206.500 |
Currently, the GBPJPY is near the upper boundary of the second support zone, which implies a potential bounce towards resistance levels shortly. The presence within the support zone offers a safety net for bullish investors.
Conclusion
The GBPJPY currency pair is showing potential recovery signals from the previous price corrections. With the established support and resistance zones, traders have clear areas to place strategic entries and exits. While the current data suggests an upward trend, investors should remain vigilant to market shifts that could alter these conditions. The balance of risk and opportunity makes GBPJPY a favorable pair to watch in the foreseeable trading sessions.
Smart Data Insight
Master the Perfect Entry & Exit for this Stock
Don't leave your profits to chance. Historically, this stock follows specific seasonal patterns that institutional traders use to maximize returns.
- ✅ Identify the "Golden Buying Window"
- ✅ Avoid high-risk correction cycles
- ✅ Backtested data from the last 20+ years