September 29, 2025 a 04:28 am
GBPJPY: Trend and Support & Resistance Analysis
The GBPJPY currency pair has been exhibiting interesting dynamics over the analyzed period. Recent data suggests subtle shifts that might indicate a change in trend. Despite fluctuations, key levels are forming that could offer insight into future movements. Observers should note both recent trends and support and resistance areas as potential indicators of what's to come.
Trend Analysis
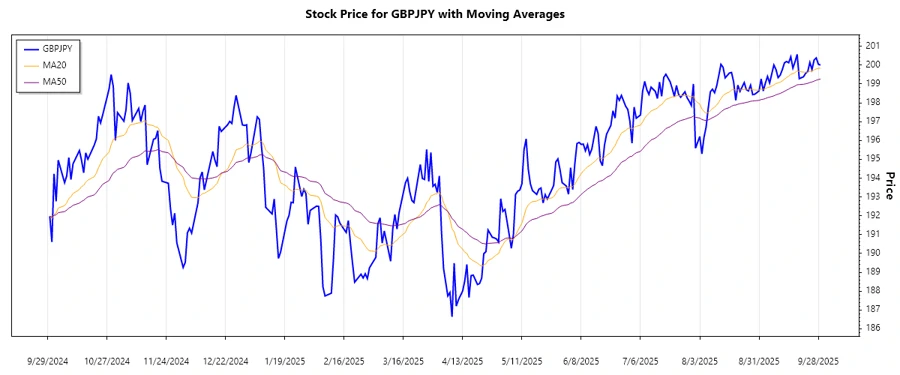
The analysis of GBPJPY over the selected period reveals nuanced changes in direction.
| Date | Close Price | Trend |
|---|---|---|
| 2025-09-29 | 200.000 | ▲ |
| 2025-09-28 | 200.047 | ▲ |
| 2025-09-27 | 200.383 | ▲ |
| 2025-09-26 | 200.268 | ▲ |
| 2025-09-25 | 199.765 | ▼ |
| 2025-09-24 | 200.143 | ▲ |
| 2025-09-23 | 199.657 | ▼ |
Current data depicts a slight upward trend, indicated by the EMA20 crossing above the EMA50. This suggests a transitory bullish phase.
Support and Resistance
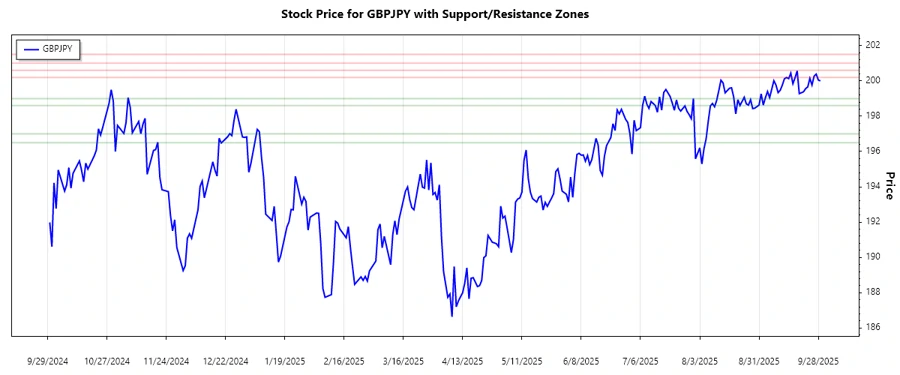
Evaluating the GBPJPY levels indicates the following zones:
| Zone | From | To |
|---|---|---|
| Support level 1 | 198.600 | 199.000 |
| Support level 2 | 196.500 | 197.000 |
| Resistance level 1 | 200.200 | 200.600 |
| Resistance level 2 | 201.000 | 201.500 |
The current price aligns closely with the first resistance zone, potentially hinting at an impending reversal or breakthrough.
Conclusion
The GBPJPY pair is showing signs of an uptrend, with current levels approaching significant resistance areas. Traders might consider this a signal for potential profits, though risks of trend reversals persist near resistance zones. Analysts should closely monitor breakout patterns in the coming days.
Smart Data Insight
Master the Perfect Entry & Exit for this Stock
Don't leave your profits to chance. Historically, this stock follows specific seasonal patterns that institutional traders use to maximize returns.
- ✅ Identify the "Golden Buying Window"
- ✅ Avoid high-risk correction cycles
- ✅ Backtested data from the last 20+ years