
June 20, 2026 a 05:08 am

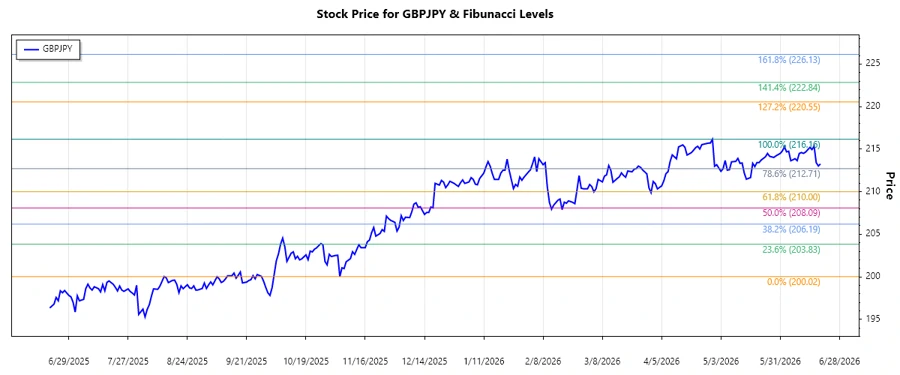
GBPJPY: Fibonacci Analysis
GBPJPY has shown significant movement over the past months, with notable fluctuations in its exchange rate. This currency pair, a reflection of the economic health of both the UK and Japan, often reacts to geopolitical and economic events in both countries. As markets remain volatile, traders are keeping a keen eye on these movements to identify potential trading opportunities or risks.
Fibonacci Analysis
An analysis of the recent trend in the GBPJPY pair indicates a dominant uptrend, having moved from a low of 200.022 on 2025-11-04 to a high of 216.16 on 2026-04-29. Using this trend, the Fibonacci retracement levels are calculated to identify potential support and resistance levels.
| Metric | Details |
|---|---|
| Start Date | 2025-11-04 |
| End Date | 2026-04-29 |
| High Point | 216.16 on 2026-04-29 |
| Low Point | 200.022 on 2025-11-04 |
| Fibonacci Level | Price Level |
|---|---|
| 0.236 | 212.771 |
| 0.382 | 209.657 |
| 0.5 | 208.091 |
| 0.618 | 206.525 |
| 0.786 | 204.309 |
Currently, the GBPJPY price is at 215.363, suggesting it is above all the key retracement levels, indicating a potential continued bullish trend.
Technical Interpretation: The price holds well above the 0.236 retracement level, suggesting strong support and a continued upward momentum unless external factors cause a reversal.
Conclusion
The GBPJPY pair has displayed a sustained upward trend, offering potential buying opportunities for bullish traders. However, as with all financial markets, risks of corrections or reversals exist, particularly in response to geopolitical or economic events in the UK or Japan. Analysts should remain alert to changes in economic indicators or policy shifts that could impact this trend. The strong support levels as identified through our Fibonacci analysis provide a conservative entry-level for cautious traders.
Smart Data Insight
Master the Perfect Entry & Exit for this Stock
Don't leave your profits to chance. Historically, this stock follows specific seasonal patterns that institutional traders use to maximize returns.
- ✅ Identify the "Golden Buying Window"
- ✅ Avoid high-risk correction cycles
- ✅ Backtested data from the last 20+ years