February 08, 2026 a 05:08 am
GBPJPY: Fibonacci Analysis
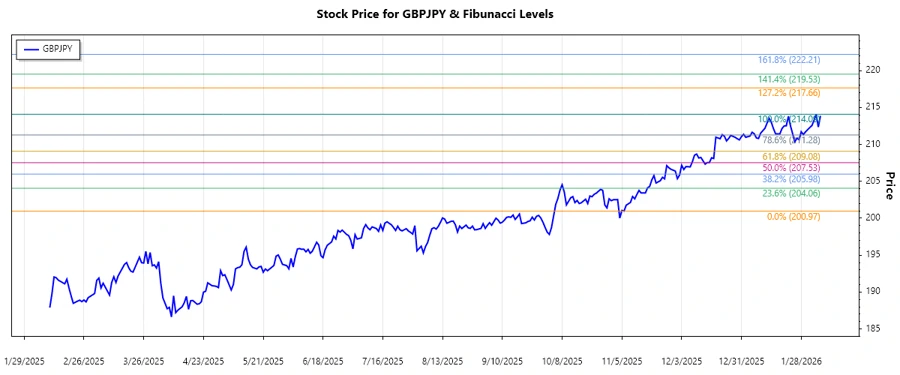
The GBPJPY currency pair has shown a significant uptrend over the past months, showcasing resilience despite global market fluctuations. The recent high at 214.094 on Feb 4, 2026, indicates a strong bullish sentiment, while the previous low on Nov 6, 2025, set the stage for this upward momentum. Technical indicators support further analysis to determine potential resistance and support levels, essential for strategic trading decisions.
Fibonacci Analysis
Analyzing the GBPJPY data reveals notable highs and lows that provide a basis for calculating Fibonacci retracement levels. Below are the key details:
| Description | Date | Price |
|---|---|---|
| Start Date of Trend | 2025-11-06 | 200.966 |
| End Date of Trend | 2026-02-04 | 214.094 |
| High Point | 2026-02-04 | 214.094 |
| Low Point | 2025-11-06 | 200.966 |
Fibonacci Retracement Levels
| Level | Price |
|---|---|
| 0.236 | 211.472 |
| 0.382 | 209.517 |
| 0.5 | 207.53 |
| 0.618 | 205.543 |
| 0.786 | 202.94 |
The current GBPJPY price at 213.881 is close to its recent high, suggesting it could be near resistance. If the price falls into one of the Fibonacci zones, particularly 0.236 or 0.382, it could mean a potential retracement is occurring. If this happens, it might act as a support level, from which prices could bounce back.
Conclusion
The GBPJPY has demonstrated a consistent uptrend over recent months, with technical indicators suggesting potential resistance near current levels. A retracement to any Fibonacci level could provide viable support, making this a critical watch area for traders. The possible bounce-back at these levels offers an opportunity for bullish traders, while failure to hold might indicate bearish potential. Thus, monitoring economic indicators and geopolitical events impacting currency sentiment remains key.