January 07, 2026 a 05:08 am
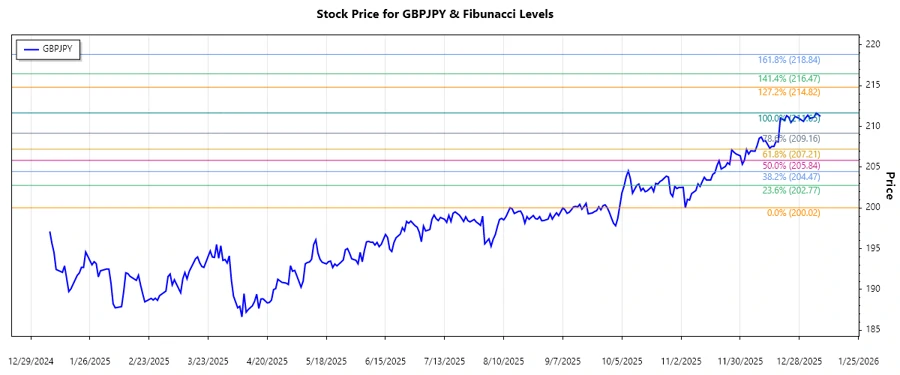
GBPJPY: Fibonacci Analysis
The GBPJPY currency pair has shown significant volatility over recent months, reflecting the broader economic conditions affecting the British and Japanese economies. The data indicates a substantial upward trend from late 2025 to early 2026, underscoring investor confidence and potential changes in interest rates or monetary policies. Monitoring this trend is crucial for traders making decisions based on technical indicators and market movements.
Fibonacci Analysis
Analyzing the GBPJPY pair from November 2025 to January 2026 reveals a clear upward trend. Using the highs and lows of this period, we calculated the Fibonacci Retracement Levels. The highest point was reached on January 7, 2026, at 211.654, while the lowest point was on November 7, 2025, at 200.022. The current price, as of January 6, 2026, is 211.445, placing it within the 0.236 retracement level. This can suggest possible support if the retracement continues.
| Parameter | Value | ||||||||||||
|---|---|---|---|---|---|---|---|---|---|---|---|---|---|
| Start Date | 2025-11-07 | ||||||||||||
| End Date | 2026-01-07 | ||||||||||||
| High Point (Price/Date) | 211.654 / 2026-01-07 | ||||||||||||
| Low Point (Price/Date) | 200.022 / 2025-11-07 | ||||||||||||
| Fibonacci Levels |
|
||||||||||||
| Current Retracement Zone | 0.236 | ||||||||||||
| Technical Interpretation | The current price position suggests the potential for a bounce back if sustained by market confidence, indicating support at this level. |
Conclusion
The GBPJPY currency pair's strong upward movement over the analyzed period offers both opportunities and risks. Continued economic optimism could drive the pair higher, potentially reaching new peaks. However, caution is advised as retracement levels may indicate possible resistance zones, where profit-taking could occur. For technical analysts, this represents a critical juncture in decision-making based on market momentum and prevailing economic indicators.