November 05, 2025 a 05:08 am
GBPJPY: Fibonacci Analysis
The GBPJPY currency pair has demonstrated a dynamic trend over the past months. With market volatility often attributed to economic and political factors affecting both the British Pound and the Japanese Yen, investors have been keenly observing these shifts. Recent data suggests significant movements that warrant a closer technical analysis to predict future price behavior.
Fibonacci Analysis
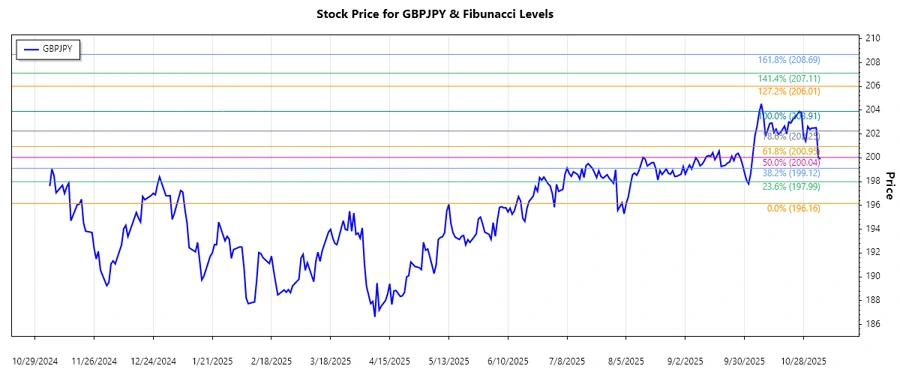
Our analysis identifies a dominant uptrend from August 5, 2025, to October 27, 2025. The pair reached a low of 196.163 on August 5, 2025, and a high of 203.908 on October 26, 2025. The following table shows the calculated Fibonacci retracement levels:
| Level | Price |
|---|---|
| 0.236 | 198.931 |
| 0.382 | 200.081 |
| 0.5 | 201.036 |
| 0.618 | 201.991 |
| 0.786 | 203.207 |
The current price of 199.898 is in the 0.236 retracement zone. This area acts as a potential support zone; investors should look for confirmation before taking any long positions.
Conclusion
The technical analysis suggests that GBPJPY is experiencing a consolidation phase, moving between key Fibonacci levels. While the 0.236 level currently acts as support, a break below could suggest further bearish movement. Conversely, sustained trading above this level might indicate a continuation of the overall uptrend, providing an opportunity for bullish traders. However, investors should remain cautious of potential geopolitical influences and monetary policy changes that might impact the pair's trajectory.
Smart Data Insight
Master the Perfect Entry & Exit for this Stock
Don't leave your profits to chance. Historically, this stock follows specific seasonal patterns that institutional traders use to maximize returns.
- ✅ Identify the "Golden Buying Window"
- ✅ Avoid high-risk correction cycles
- ✅ Backtested data from the last 20+ years