August 20, 2025 a 05:08 am
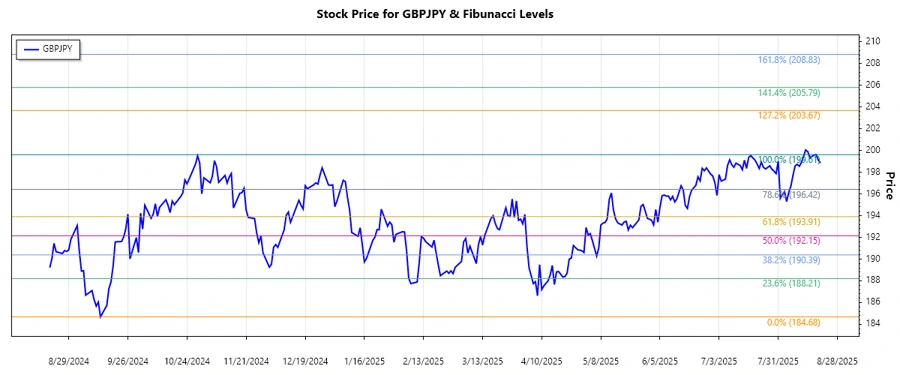
GBPJPY: Fibonacci Analysis
The GBPJPY has been exhibiting a pronounced upward trend over the last few months. The pair has shown strength in recovering from previous lows, with bulls taking significant control. This currency pair is sensitive to both GBP and JPY economic changes, making it a closely watched pair among traders.
Fibonacci Analysis
The GBPJPY has been on an upward trajectory. Using the identified high and low during the specified period, we calculated the Fibonacci retracement levels.
| Detail | Value |
|---|---|
| Trend Start Date | 2024-09-13 |
| Trend End Date | 2025-08-18 |
| High Price | 199.609 (2025-08-18) |
| Low Price | 184.684 (2024-09-13) |
Fibonacci Levels
| Retracement Level | Price Level |
|---|---|
| 23.6% | 191.75 |
| 38.2% | 194.46 |
| 50.0% | 197.15 |
| 61.8% | 199.84 |
| 78.6% | 202.91 |
The current price of GBPJPY is around 198.849, which places it near the 50% retracement level. This indicates a possible support level that could catalyze further upward momentum. Should the price hover around this level without breaking lower, it could confirm strong support.
Conclusion
The recent upward trend in GBPJPY highlights the currency pair's potential for continued gains. However, traders should remain cautious and monitor key economic indicators from both the UK and Japan. While the Fibonacci retracement levels provide potential support and resistance areas, external market factors should also be considered. Overall, the 50% retracement level could act as a significant support, serving both as a buying opportunity and a marker for an impending reversal if breached.
Smart Data Insight
Master the Perfect Entry & Exit for this Stock
Don't leave your profits to chance. Historically, this stock follows specific seasonal patterns that institutional traders use to maximize returns.
- ✅ Identify the "Golden Buying Window"
- ✅ Avoid high-risk correction cycles
- ✅ Backtested data from the last 20+ years