May 09, 2026 a 04:28 am
GBPCHF: Trend and Support & Resistance Analysis
The GBPCHF currency pair displays a complex pattern over the recent months, showing significant fluctuations. As we assess the current market, it is essential to recognize key technical indicators that reflect potential future movements. Recent data exhibits a blend of upward momentum and consolidation phases, posing both opportunities and challenges for traders.
Trend Analysis
| Date | Close Price | Trend |
|---|---|---|
| 2026-05-08 | 1.05758 | ▼ Abwärtstrend |
| 2026-05-07 | 1.05601 | ▼ Abwärtstrend |
| 2026-05-06 | 1.05713 | ▼ Abwärtstrend |
| 2026-05-05 | 1.05920 | ▲ Aufwärtstrend |
| 2026-05-04 | 1.05900 | ▲ Aufwärtstrend |
| 2026-05-03 | 1.06094 | ▲ Aufwärtstrend |
| 2026-05-02 | 1.06119 | ▲ Aufwärtstrend |
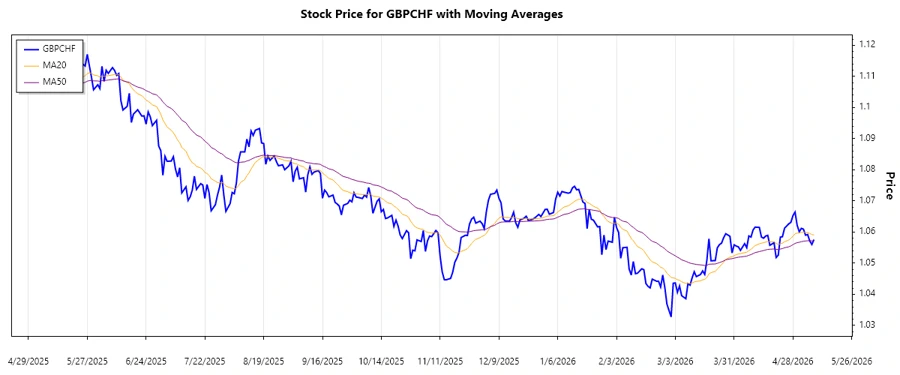
The GBPCHF pair has exhibited a mix of trends in the short term, recently shifting towards a downtrend, as interpreted by technical indicators like EMA20 crossing below EMA50. Such dynamics may indicate upcoming bearish momentum, warranting caution among investors.
Support- and Resistance
| Zone | Support / Resistance Range |
|---|---|
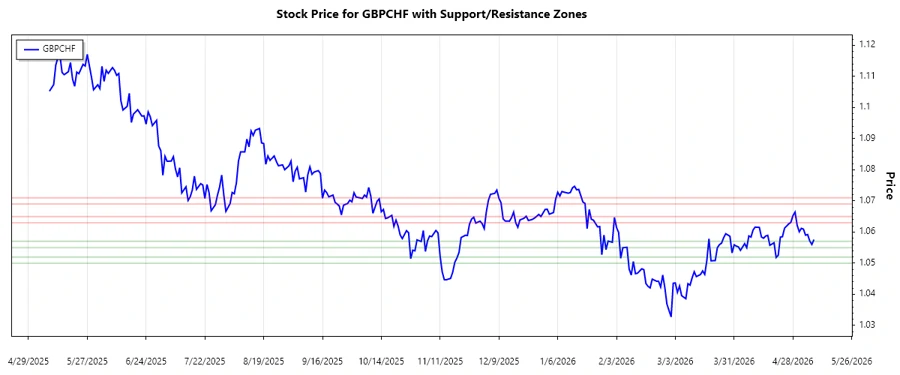
| Support Zone 1 | 1.05000 - 1.05200 |
| Support Zone 2 | 1.05500 - 1.05700 |
| Resistance Zone 1 | 1.06300 - 1.06500 |
| Resistance Zone 2 | 1.06900 - 1.07100 |
The current price hovers between established support and resistance levels. It remains crucial to watch whether it breaks below or rises above these levels, potentially indicating further trend shifts.
Conclusion
Overall, the GBPCHF remains a dynamic trading pair with mixed trends observed recently. Analyzing the movement between support and resistance zones offers strategic trading opportunities. However, potential shifts towards bearish trends necessitate careful risk management. Analysts should continuously monitor key EMAs and market signals for further insights.
Smart Data Insight
Master the Perfect Entry & Exit for this Stock
Don't leave your profits to chance. Historically, this stock follows specific seasonal patterns that institutional traders use to maximize returns.
- ✅ Identify the "Golden Buying Window"
- ✅ Avoid high-risk correction cycles
- ✅ Backtested data from the last 20+ years