March 23, 2026 a 04:28 am
GBPCHF: Trend and Support & Resistance Analysis
Over the past months, GBPCHF has demonstrated a significant downtrend. The dynamic nature of the exchange rate points to underlying market volatility. It is crucial for traders to monitor these changes closely, as technical indicators suggest potential shifts. The focus remains on identifying crucial support and resistance zones.
Trend Analysis
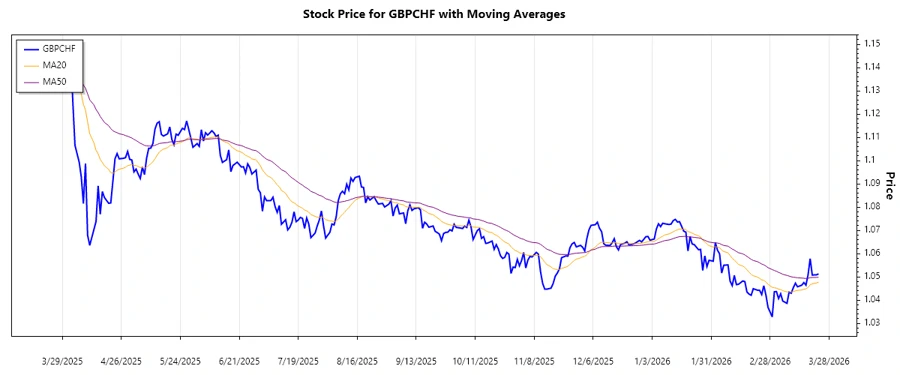
The GBPCHF has experienced a notable downward trend recently. By calculating the exponential moving averages (EMAs), we see an alignment indicating a prevailing trend. Specifically, the EMA20 is consistently below the EMA50, confirming a prolonged ▼ downtrend. The following table outlines the data for the past 7 days:
| Date | Closing Price | Trend |
|---|---|---|
| 2026-03-23 | 1.05126 | ▼ |
| 2026-03-22 | 1.05085 | ▼ |
| 2026-03-20 | 1.05076 | ▼ |
| 2026-03-19 | 1.05784 | ▼ |
| 2026-03-18 | 1.05085 | ▼ |
| 2026-03-17 | 1.0464 | ▼ |
| 2026-03-16 | 1.04753 | ▼ |
The trend indicates a bearish outlook on the GBPCHF, which may lead to further price declines if this pattern continues.
Support and Resistance
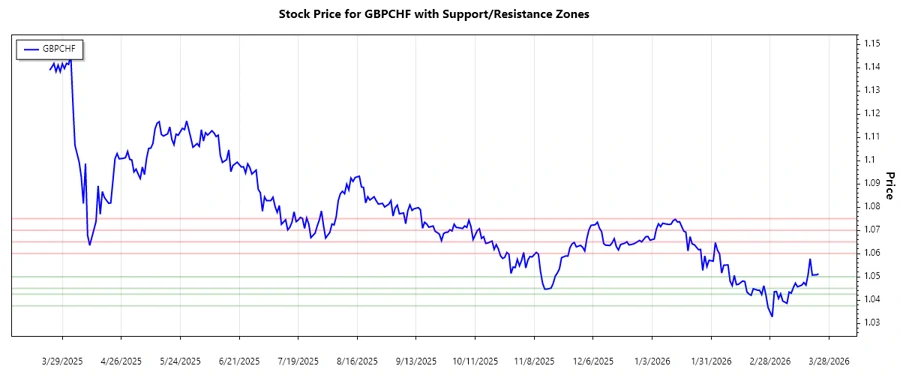
The trading data emphasizes critical support and resistance levels. Support levels are found where the currency pair historically resisted further downward movement, while resistance levels have been prominent at price peaks. Here’s an overview of the identified zones:
| Zone Type | From | To | |
|---|---|---|---|
| Support Zone 1 | 1.0450 | 1.0500 | ▲ |
| Support Zone 2 | 1.0375 | 1.0425 | ▲ |
| Resistance Zone 1 | 1.0600 | 1.0650 | ▼ |
| Resistance Zone 2 | 1.0700 | 1.0750 | ▼ |
The current price is nearer to the first support zone, suggesting a potential area of price consolidation or reversal.
Technically, if the GBPCHF holds above the indicated support zones, it may indicate traders' confidence to buy, potentially reversing the trend.
Conclusion
In conclusion, GBPCHF is currently witnessing a bearish trend, emphasized by the EMA indicators and support/resistance analysis. Short-term traders may find opportunities by capitalizing on the identified support zones. However, a breach below support may lead to further depreciation, presenting potential risks. Therefore, analysts should keep an eye on macroeconomic factors and market sentiment for better insights.