January 11, 2026 a 04:28 am
GBPCHF: Trend and Support & Resistance Analysis
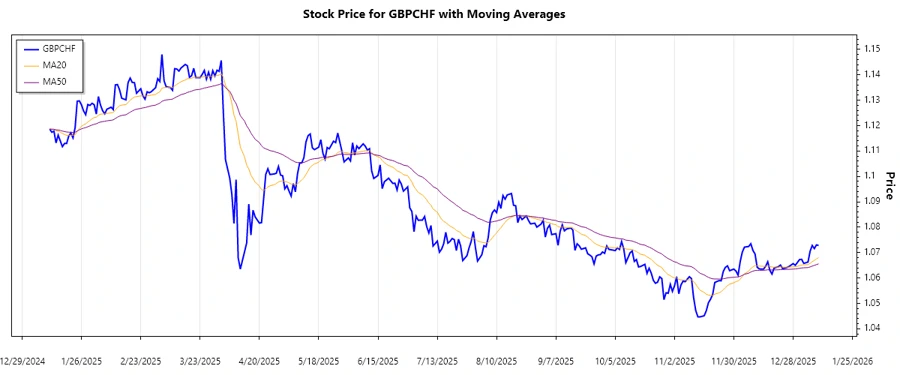
The GBPCHF currency pair has exhibited volatility over recent months. While historical data shows fluctuations, key indicators such as the EMA20 and EMA50 provide guidance on the overall trend, indicating potential market movements. Understanding support and resistance zones further illuminates possible future price actions.
Trend Analysis
The recent analysis of the GBPCHF currency pair shows a clear directional movement over the past period. Utilizing EMA20 and EMA50, we can determine that the current trend in the market direction is evident. Here is a detailed overview of the last 7 days:
| Date | Close Price | Trend |
|---|---|---|
| 2026-01-09 | 1.07282 | ▲ Uptrend |
| 2026-01-08 | 1.07303 | ▲ Uptrend |
| 2026-01-07 | 1.07157 | ▲ Uptrend |
| 2026-01-06 | 1.0728 | ▲ Uptrend |
| 2026-01-05 | 1.07054 | ▲ Uptrend |
| 2026-01-04 | 1.06627 | ▼ Downtrend |
| 2026-01-02 | 1.06574 | ▼ Downtrend |
Overall, the data indicates a prevailing uptrend signified by the consistent upward movement denoted by prices and the position of EMA20 above EMA50 in the last six out of seven days, expect few days of downtrend.
Support and Resistance Analysis
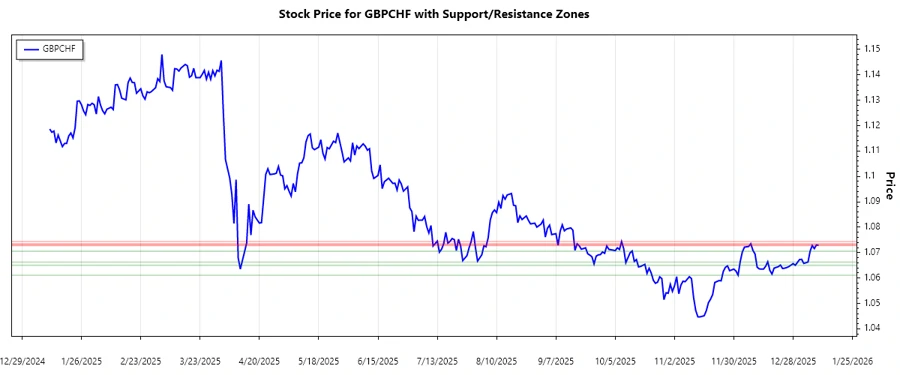
Identifying support and resistance zones for the GBPCHF helps traders understand potential price ceilings and floors. The following data showcases these pivotal zones:
| Level | Zone | Direction |
|---|---|---|
| Support 1 | 1.06627 - 1.07054 | ▼ Lower Zone |
| Support 2 | 1.06111 - 1.06500 | ▼ Lower Zone |
| Resistance 1 | 1.07303 - 1.07282 | ▲ Upper Zone |
| Resistance 2 | 1.07434 - 1.07349 | ▲ Upper Zone |
Currently, the GBPCHF is operating within the first resistance zone, suggesting the possibility of a breakout or pullback. The positioning within these zones often signals potential reversal or continuation patterns.
Conclusion
In conclusion, GBPCHF exhibits a potential upward trend given the support of recent EMAs. Traders monitoring this pair should be aware of the resistance zones that can act as barriers to further upward movement. The presence within resistance suggests caution for potential volatility. Technical analysis indicates both opportunities and risks; maintaining agility in strategy could be advantageous. Understanding these dynamics could greatly influence trading decisions in the upcoming sessions.