August 23, 2025 a 04:28 am
GBPCHF: Trend and Support & Resistance Analysis
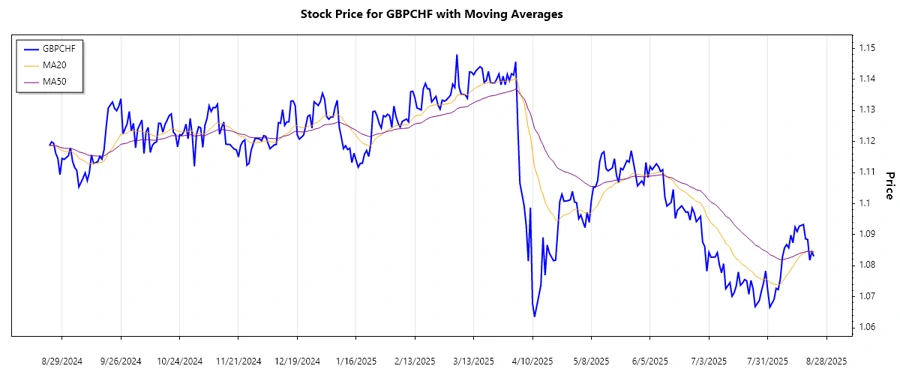
The GBPCHF currency pair has shown notable volatility over the recent months. Our analysis highlights a shift from a sideways to a dominant downward trend in recent weeks. Identifying key support and resistance zones provides strategic entry points for traders. A thorough understanding of the moving averages reveals the underlying momentum in the market.
Trend Analysis
Recent price action in the GBPCHF currency pair indicates a transition to a dominant ▼ downtrend, as visible with the EMA20 crossing below the EMA50. Historical price data points to a descending trend with price levels consistently challenging lower boundaries.
| Date | Close Price | Trend |
|---|---|---|
| 2025-08-22 | 1.08302 | ▼ |
| 2025-08-21 | 1.08443 | ▼ |
| 2025-08-20 | 1.08178 | ▼ |
| 2025-08-19 | 1.08845 | ▼ |
| 2025-08-18 | 1.08863 | ▼ |
| 2025-08-17 | 1.09327 | ▼ |
| 2025-08-15 | 1.09270 | ▼ |
Technically, this continued decline signals market pessimism, prompting consideration for further potential declines.
Support and Resistance
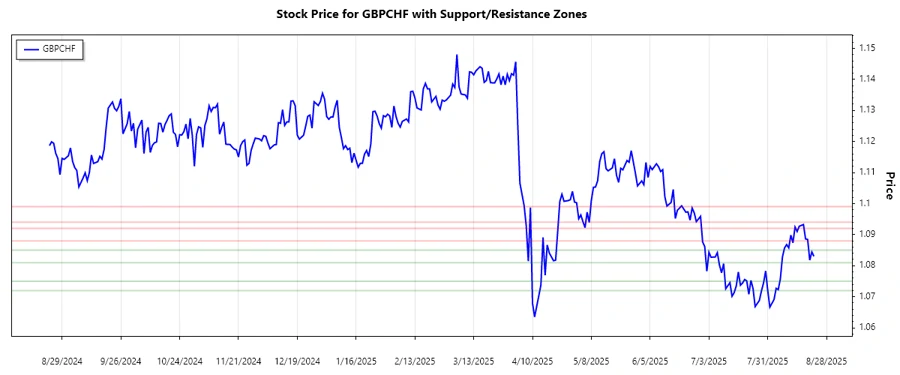
Analyzing the support and resistance levels for GBPCHF reveals significant areas where price repeatedly reacts. These zones help in setting stop-loss and target prices.
| Zone | From | To |
|---|---|---|
| Support 1 | 1.07200 | 1.07500 |
| Support 2 | 1.08100 | 1.08500 |
| Resistance 1 | 1.08800 | 1.09200 |
| Resistance 2 | 1.09400 | 1.09900 |
Currently, the GBPCHF is nearing a support zone, which might offer a short-term buying opportunity given potential price reactions.
Conclusion
The GBPCHF currency pair's recent downtrend, coupled with its distinct support and resistance zones, suggests bearish market sentiment. The trend's continuation could be contingent on fundamental shifts or unforeseen events. Traders may benefit from closely monitoring the price movements around the support zones for potential entries. On the downside, failing to hold these levels could accelerate further losses, creating additional selling opportunities.
Smart Data Insight
Master the Perfect Entry & Exit for this Stock
Don't leave your profits to chance. Historically, this stock follows specific seasonal patterns that institutional traders use to maximize returns.
- ✅ Identify the "Golden Buying Window"
- ✅ Avoid high-risk correction cycles
- ✅ Backtested data from the last 20+ years