March 13, 2026 a 05:08 amGBPCHF: Fibonacci Analysis
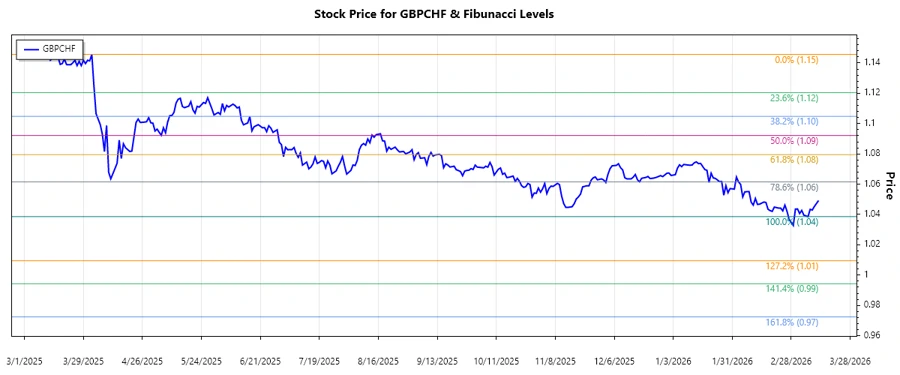
The currency pair GBPCHF has shown significant volatility over the months, influenced by economic data releases from both the UK and Switzerland. Recently, the pair has been in a downtrend, evident from declining highs and lower lows. With the interplay of monetary policies and geopolitical tensions, the trend's persistence remains unpredictable, yet it offers potential entry and exit calls for forex traders.
Fibonacci Analysis
| Detail | Value |
|---|---|
| Start Date | 2025-04-02 |
| End Date | 2026-03-13 |
| High Point (Price and Date) | 1.14566 on 2025-04-02 |
| Low Point (Price and Date) | 1.03859 on 2026-03-08 |
| Fibonacci 0.236 Level | 1.06561 |
| Fibonacci 0.382 Level | 1.08628 |
| Fibonacci 0.5 Level | 1.09242 |
| Fibonacci 0.618 Level | 1.11056 |
| Fibonacci 0.786 Level | 1.12378 |
| Current Price | 1.04922 |
| Retracement Zone | None |
The current price of GBPCHF does not reside in any conventional Fibonacci retracement levels, suggesting limited bullish retracement momentum at the moment. This analysis suggests recent support may eventually give way to further declines if not counteracted by significant bullish pressure.
Conclusion
The downtrend for GBPCHF shows a strong bearish sentiment, with the price not finding solace within key Fibonacci retracement levels. If the price is not drawn back by buyers, the bearish trend might continue to test newer lows. Despite an inherent risk, careful monitoring of economic indicators and strategic pivot points might give traders an edge in capturing potential reversals or consolidations.