January 28, 2026 a 05:08 am
GBPCHF: Fibonacci Analysis
The GBPCHF pair shows intriguing patterns with potential shifts as indicated by the recent trends. The fluctuations against the Swiss Franc reveal historical volatility owing to economic data from the UK and Switzerland. Currency analysts often watch this pair for opportunities arising from geopolitical events and central bank policies.
Fibonacci Analysis
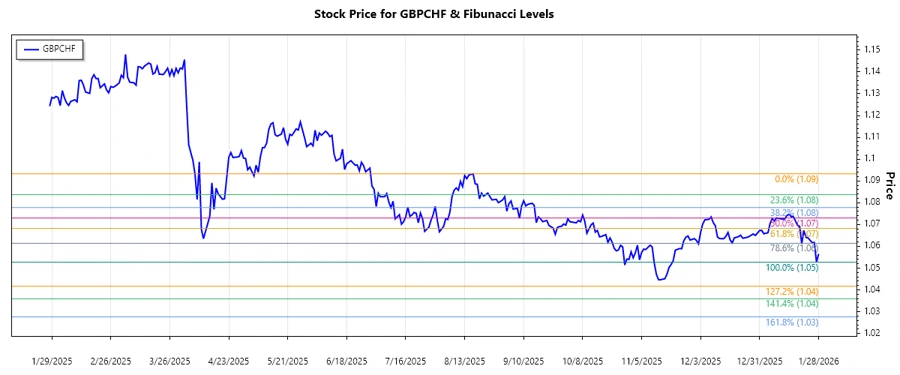
The analysis identifies a dominant downtrend between November 17, 2025, and January 23, 2026, with the highest point at 1.09327 on November 17, 2025, and the lowest point at 1.0527 on January 27, 2026.
| Fibonacci Level | Price Level |
|---|---|
| 0.236 | 1.06317 |
| 0.382 | 1.07027 |
| 0.5 | 1.07299 |
| 0.618 | 1.07571 |
| 0.786 | 1.07955 |
The current price at 1.05649 is beneath the 0.236 Fibonacci retracement level, suggesting it is not within a retracement zone currently. This positioning below significant levels often implies a lack of upward momentum, with potential resistance at the 0.236 level.
Conclusion
The analysis of GBPCHF indicates a prevailing downtrend over the reviewed period. Although there was a minor recovery attempt, the lack of penetration into retracement zones suggests persistent bearish sentiment. Investors should be cautious due to potential resistance around the 1.06317 level. Market participants should also consider broader economic factors influencing the British Pound and Swiss Franc which could impact future movement. Monitoring economic indicators and central bank activity remains crucial. While short-term rebounds are possible, sustained upward movement requires breaking significant Fibonacci levels.