September 24, 2025 a 05:08 am
GBPCHF: Fibonacci Analysis
The GBPCHF pair has experienced a strong downward trend over recent months. This analysis covers a significant period where the pair has seen notable price movements, providing insight into potential future support or resistance zones based on Fibonacci retracement levels. GBPCHF is historically sensitive to economic indicators from both the UK and Switzerland, which should be considered in conjunction with technical analysis.
Fibonacci Analysis
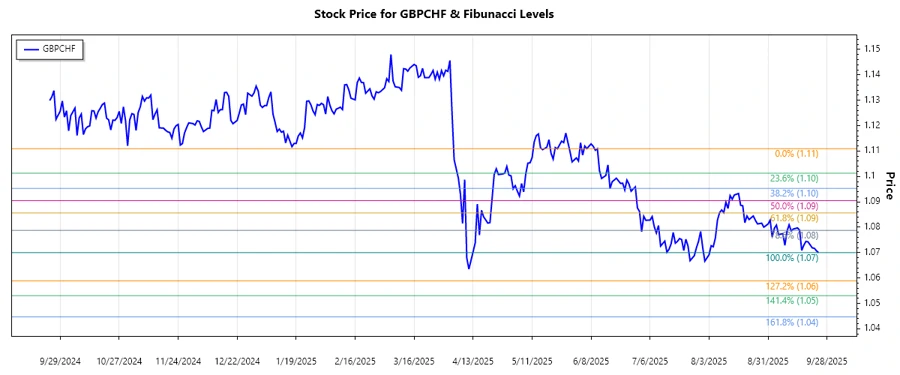
The GBPCHF pair has been in a dominant downward trend starting from June 11, 2025, at a high of 1.11092, and reaching a low on September 24, 2025, at 1.06999. Utilizing these key points, we calculate the following Fibonacci retracement levels:
| Level | Retracement Price |
|---|---|
| 0.236 | 1.08129 |
| 0.382 | 1.08913 |
| 0.5 | 1.09046 |
| 0.618 | 1.09179 |
| 0.786 | 1.09394 |
Currently, the price is at 1.06999 which is below the 0.236 retracement level. This suggests that GBPCHF is not in a retracement zone at this moment. The absence in these zones indicates continuing bearish sentiment, unless a reversal is confirmed above these levels. Technically, these levels might serve as potential resistances should the price reverse and test them.
Conclusion
The GBPCHF is currently experiencing a strong bearish trend, as reflected by its position below the Fibonacci retracement levels. The dominance of selling pressure suggests limited temporary upward corrections unless significant economic factors influence the market. Analysts must consider potential risks related to geopolitical and macroeconomic developments in both the UK and Switzerland. The current technical pattern indicates possible continued downward movement, but traders should remain alert for any breakout above resistance levels which may signal a trend reversal.
Smart Data Insight
Master the Perfect Entry & Exit for this Stock
Don't leave your profits to chance. Historically, this stock follows specific seasonal patterns that institutional traders use to maximize returns.
- ✅ Identify the "Golden Buying Window"
- ✅ Avoid high-risk correction cycles
- ✅ Backtested data from the last 20+ years