June 27, 2026 a 04:28 am


GBPCAD: Trend and Support & Resistance Analysis
The GBPCAD currency pair has recently shown notable fluctuations. The analysis reveals a series of trends and support-resistance zones that are vital for traders to consider. Understanding these patterns could be key for making informed trading decisions. Furthermore, the technical indicators provide insights into potential future movements of the currency pair. Observing these elements might help traders align their trading strategies with market dynamics. Overall, the GBPCAD shows potential opportunities for both long and short positions.
Trend Analysis
The recent analysis of GBPCAD, based on daily closing prices and exponential moving averages (EMA), indicates an upward trend in the short term. By calculating the EMA20 and EMA50, we observe that EMA20 is slightly greater than EMA50, suggesting ▲ an uptrend. Below is a detailed table for the last 7 days, offering a precise view of the price movement and overall trend.
| Date | Close Price | Trend |
|---|---|---|
| 2026-06-26 | 1.87177 | ▲ |
| 2026-06-25 | 1.87189 | ▲ |
| 2026-06-24 | 1.87271 | ▲ |
| 2026-06-23 | 1.87555 | ▲ |
| 2026-06-22 | 1.87536 | ▲ |
| 2026-06-21 | 1.87481 | ▲ |
| 2026-06-19 | 1.87302 | ▲ |
The use of the EMA20 greater than EMA50 substantiates the presence of an upward trend, which could represent a potential pathway for bullish strategies.
Support and Resistance
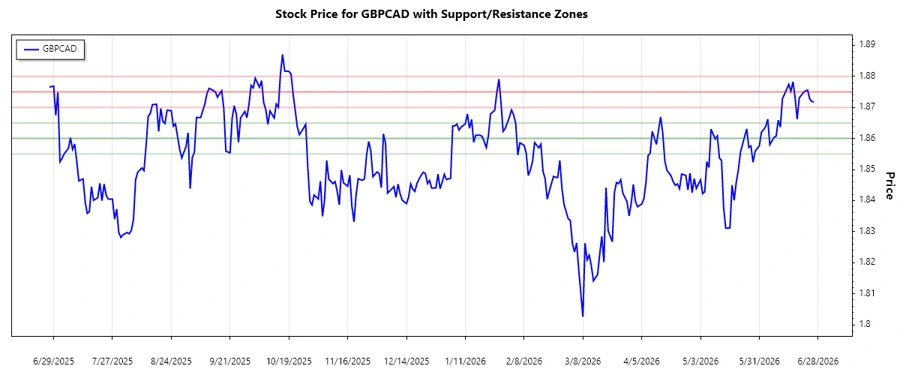
Delving into the support and resistance zones, two key support levels around 1.860 and 1.865 have been identified. On the resistance side, the levels to watch are near 1.875 and 1.880. Below is a detailed overview of these zones.
| Zone Type | From | To |
|---|---|---|
| Support | 1.860 | 1.865 |
| Support | 1.855 | 1.860 |
| Resistance | 1.875 | 1.880 |
| Resistance | 1.870 | 1.875 |
Currently, the GBPCAD is trading close to the resistance zone of 1.875 to 1.880, which signifies potential profit-taking or reversal areas. Observers should consider these levels critically to anticipate possible market reversals.
Conclusion
In summary, the GBPCAD currency pair displays a positive trend, aided by strong technical signals. The presence of identifiable support and resistance zones allows traders to gauge potential entry and exit points effectively. While the upward trend could suggest bullish opportunities, the proximity to resistance zones serves as a notable caution for potential pullbacks. As market dynamics evolve, persistent monitoring of these levels can aid in capitalizing on market movements. No trade is without risk; hence, a balanced risk management strategy is recommended. Thorough analysis and strategic planning could lead to successful trading endeavors.
Smart Data Insight
Master the Perfect Entry & Exit for this Stock
Don't leave your profits to chance. Historically, this stock follows specific seasonal patterns that institutional traders use to maximize returns.
- ✅ Identify the "Golden Buying Window"
- ✅ Avoid high-risk correction cycles
- ✅ Backtested data from the last 20+ years