January 28, 2026 a 04:28 am

GBPCAD: Trend and Support & Resistance Analysis
The GBPCAD currency pair has shown dynamic movements over the past few months. It exhibits periodical shifts influenced by economic factors affecting both the British Pound and the Canadian Dollar. Recent data indicates a subtle inclination towards an uptrend, yet careful observation of support and resistance zones is necessary for a clear trading opportunity. Such a currency pair is crucial for traders focusing on the Forex market to watch given its impact by political and economic developments.
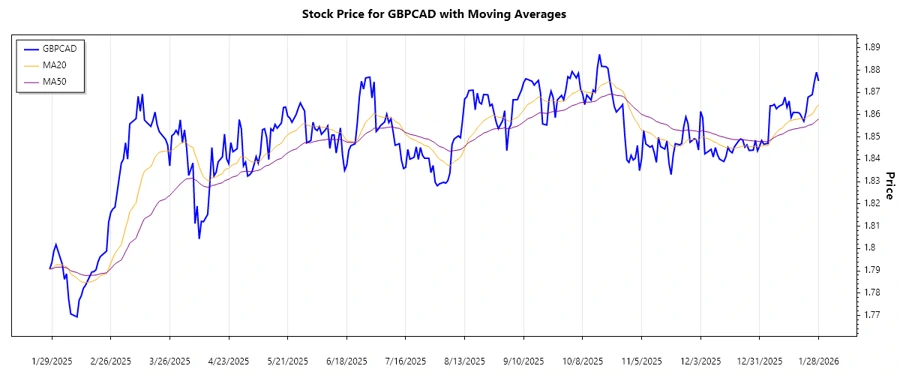
Trend Analysis
The recent assessment of GBPCAD through the lens of moving averages reveals an interesting pattern. The calculated EMA20 is currently greater than EMA50, indicating a ▲ uptrend over the observed period.
| Date | Close Price | Trend |
|---|---|---|
| 2026-01-28 | 1.87516 | ▲ |
| 2026-01-27 | 1.87911 | ▲ |
| 2026-01-26 | 1.87478 | ▲ |
| 2026-01-25 | 1.86904 | ▲ |
| 2026-01-23 | 1.86788 | ▲ |
| 2026-01-22 | 1.86093 | ▲ |
| 2026-01-21 | 1.85707 | ▲ |
The calculated EMAs suggest that the market may continue its upward momentum unless external factors disrupt this trend. This uptrend is indicated by the sequence of higher closing prices over the past days.
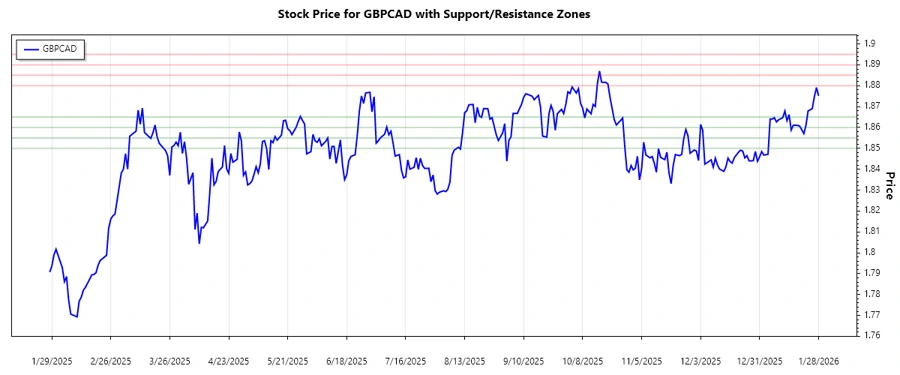
Support and Resistance
Reviewing recent price data allows the identification of crucial support and resistance zones. The GBPCAD currently shows two key support and resistance zones, reflecting crucial areas for potential market reversal.
| Zone Type | From | To |
|---|---|---|
| Support Zone 1 | 1.86000 | 1.86500 |
| Support Zone 2 | 1.85000 | 1.85500 |
| Resistance Zone 1 | 1.88000 | 1.88500 |
| Resistance Zone 2 | 1.89000 | 1.89500 |
Currently, the price approaches the lower boundary of a resistance zone. This situation signals a potential turning point if the price finds resistance at this level. The identification of these zones allows traders to make informed decisions based on potential market reversals.
Conclusion
The GBPCAD showcases a slight upward trend as identified by the difference between EMA20 and EMA50. This trend, combined with observed market levels that suggest reliable support at lower prices, indicates a stabilized market outlook. However, caution should be used, as the approach towards resistance zones could result in a reversal or consolidation. An analysis of recent fundamental influences will assist traders in aligning technical signals with market context, essential for strategic trading and hedging opportunities.