December 03, 2025 a 04:28 am

GBPCAD: Trend and Support & Resistance Analysis
The analysis of the GBPCAD's recent performance indicates a moderately bearish sentiment in the market. Over the past several months, fluctuations have been observed with potential recovery periods. It is essential to monitor moving averages and critical support and resistance levels closely, as these can guide timely decisions for traders.
Trend Analysis
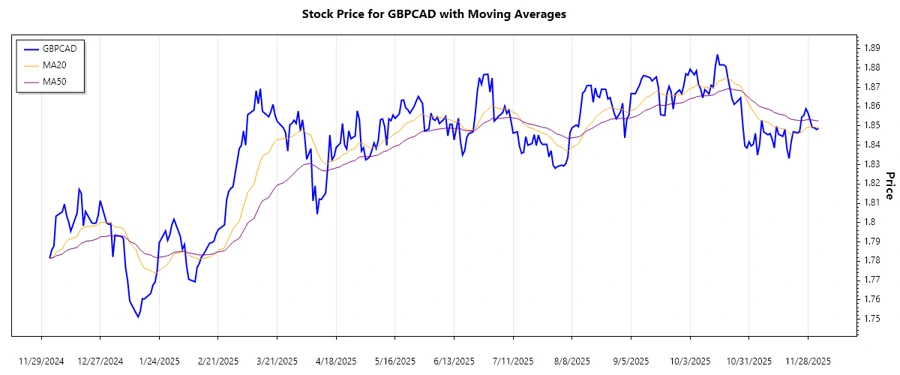
The analysis of GBPCAD involves examining fluctuations and their intersection with calculated moving averages. Recent data suggests a weakening trend, where the EMA20 has begun falling below the EMA50, signaling a potential bearish momentum. The displayed table elaborates the final seven days of trading, highlighting trends with intuitive indicators.
| Date | Closing Price | Trend |
|---|---|---|
| 2025-12-03 | 1.84872 | ▼ |
| 2025-12-02 | 1.84821 | ▼ |
| 2025-12-01 | 1.84914 | ▼ |
| 2025-11-30 | 1.84923 | ▼ |
| 2025-11-28 | 1.85670 | ▲ |
| 2025-11-27 | 1.85898 | ▲ |
| 2025-11-26 | 1.85545 | ▲ |
The decline in the EMA20 relative to the EMA50 reaffirms the downtrend that has emerged. Traders should exercise caution in the short term, as further downside pressure may manifest.
Support and Resistance
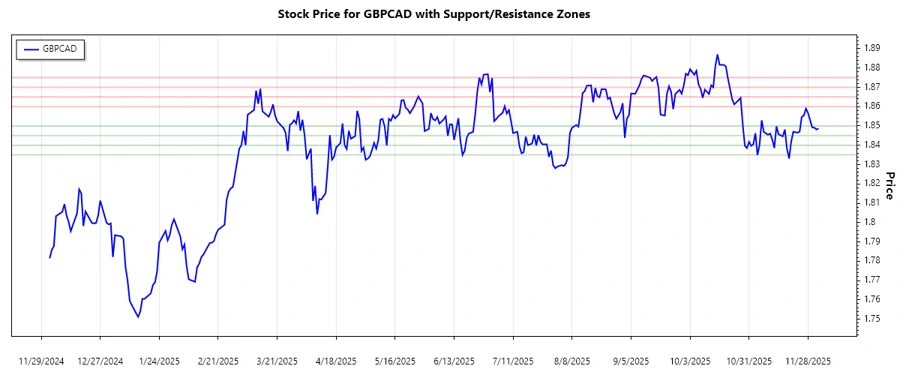
Support and resistance levels are crucial for trading GBPCAD. Calculating these levels helps identify potential price reversals. Below are the current key zones providing insights into the pair's behavior.
| Zone Type | From | To |
|---|---|---|
| Support Zone 1 | 1.83500 | 1.84000 |
| Support Zone 2 | 1.84500 | 1.85000 |
| Resistance Zone 1 | 1.86000 | 1.86500 |
| Resistance Zone 2 | 1.87000 | 1.87500 |
Currently, GBPCAD appears to be trading within the second support zone, indicative of a potential buy opportunity if this level holds firm. A break below could lead to further bearish momentum.
Conclusion
In summary, the GBPCAD currency pair is showing weakness with potential for ongoing bearish moves. Support levels provide immediate buying opportunities, though traders should approach with caution due to the prevailing downward trend. Resistance is identified at higher levels, posing challenges for upward reversals. Continued monitoring of trend indicators and price action at critical levels will aid traders in taking informed positions.