October 19, 2025 a 04:28 am
GBPCAD: Trend and Support & Resistance Analysis
The GBPCAD currency pair has experienced noticeable fluctuations over the past few months. With several key levels of support and resistance being tested, the currency pair shows potential volatility in upcoming trading sessions. Technical indicators suggest cautious optimism, although traders should remain alert for sudden shifts.
Trend Analysis
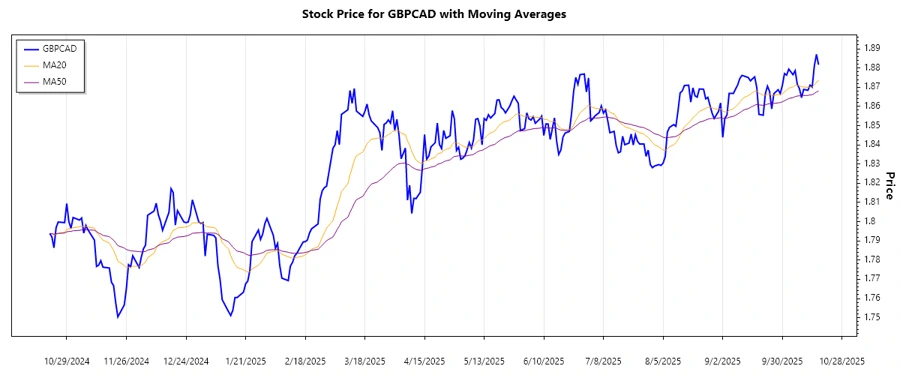
The analysis of GBPCAD over recent months shows a mix of trends, with the EMA calculations suggesting a predominant trend. Over the last seven days, the currency pair has shown variability, with the EMA20 and EMA50 intersecting.
| Date | Closing Price | Trend |
|---|---|---|
| 2025-10-17 | 1.88169 | ▲ Upward |
| 2025-10-16 | 1.88707 | ▲ Upward |
| 2025-10-15 | 1.88101 | ▲ Upward |
| 2025-10-14 | 1.87004 | ▼ Downward |
| 2025-10-13 | 1.87108 | ▼ Downward |
| 2025-10-12 | 1.86840 | ▼ Downward |
| 2025-10-10 | 1.86884 | ▲ Upward |
The interpretation of the EMA indicators suggests that while there are short-term upward movements, the overall trend indicates potential consolidation. This could be a precursor to a significant breakout or a sustained correction.
Support and Resistance
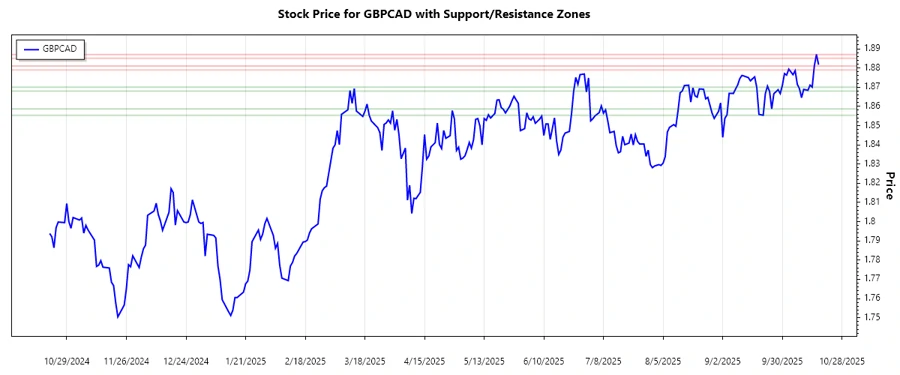
The support and resistance analysis reveals key levels where the pair may find buying or selling pressure. Over the analyzed period, certain zones have consistently shown as significant:
| Zone | Level |
|---|---|
| Support Zone 1 | 1.85540 - 1.85871 ▲ |
| Support Zone 2 | 1.86800 - 1.87000 ▲ |
| Resistance Zone 1 | 1.87900 - 1.88100 ▼ |
| Resistance Zone 2 | 1.88500 - 1.88700 ▼ |
Currently, the price hovers near the upper range of the Resistance Zone 1. This suggests traders could see potential price corrections if upward momentum does not persist. Monitoring the breakout or rejection at these levels is critical.
Conclusion
In summary, the GBPCAD currency pair presents mixed signals with its current positioning within crucial resistance zones. While recent movements hint at a potential breakout, the proximity to major resistance levels suggests careful monitoring. Traders should remain vigilant for a decisive move either above resistance or a fallback into the support zones, which could set the tone for future price action. With the technical indicators showing varied short-term trends, market participants need to balance risks and rewards, patronizing only when a clearer direction emerges.
Smart Data Insight
Master the Perfect Entry & Exit for this Stock
Don't leave your profits to chance. Historically, this stock follows specific seasonal patterns that institutional traders use to maximize returns.
- ✅ Identify the "Golden Buying Window"
- ✅ Avoid high-risk correction cycles
- ✅ Backtested data from the last 20+ years