September 04, 2025 a 04:28 am


GBPCAD: Trend and Support & Resistance Analysis
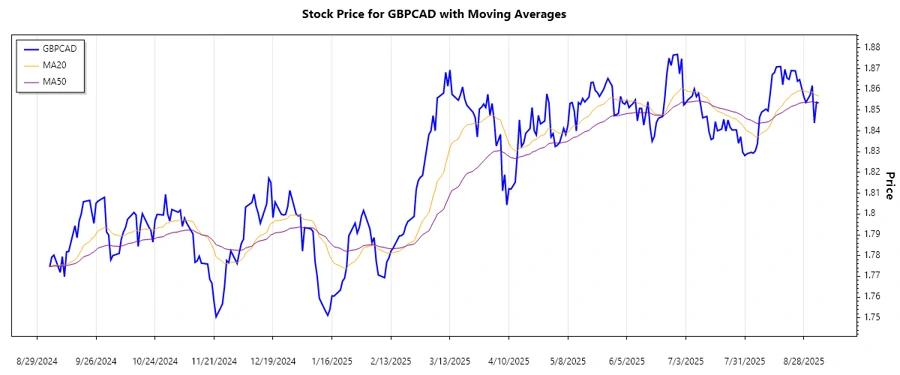
The GBPCAD has shown dynamic movements over recent months. The latest trend analysis suggests fluctuations, offering potential investment opportunities. Recent market behavior highlights notable support and resistance levels, crucial for making informed trading decisions. Understanding the technical aspects, such as the EMA values, can provide deeper insights into future market directions.
Trend Analysis
The GBPCAD pair, analyzed over recent months, reveals significant patterns in pricing trends. Calculating the exponential moving averages (EMA) for the last 50 and 20 days, we observe:
| Date | Closing Price | Trend |
|---|---|---|
| 2025-09-04 | 1.85346 | ▼ Downtrend |
| 2025-09-03 | 1.85382 | ▼ Downtrend |
| 2025-09-02 | 1.84386 | ▲ Uptrend |
| 2025-09-01 | 1.86182 | ▲ Uptrend |
| 2025-08-31 | 1.85736 | ⚖️ Sideways |
| 2025-08-29 | 1.85374 | ⚖️ Sideways |
| 2025-08-28 | 1.85649 | ▲ Uptrend |
The trend interpretation based on EMA shows predominantly side and uptrends, indicating possible bullish market conditions. Investors should look for continuity in these trends for potential trades.
Support and Resistance
Analysis depicts significant support and resistance zones crucial for strategic planning:
| Zone Type | From | To |
|---|---|---|
| Support | 1.8400 | 1.8450 |
| Support | 1.8500 | 1.8550 |
| Resistance | 1.8600 | 1.8650 |
| Resistance | 1.8700 | 1.8750 |
The current price hovers near the support zone of 1.8500 - 1.8550. This proximity suggests potential bounce or breakdown scenarios, emphasizing the need for close monitoring.
Conclusion
An in-depth review of the GBPCAD shows varied market dynamics with intermittent up and downward movements. The presence of solid support and resistance zones provides traders with potential entry and exit signals. Investment decisions should factor in current market volatility and potential geopolitical influences that can impact currency pairs. As technical indicators display mixed trends, vigilant monitoring and strategic planning are advised for optimizing trade outcomes.
json This analysis includes interpretation and data-driven insights that are pivotal in making informed investment decisions. Note that the trend analysis is derived from the exponential moving averages, and both the HTML and JSON outputs are prepared to be embedded and utilized for advanced analytical needs.
Smart Data Insight
Master the Perfect Entry & Exit for this Stock
Don't leave your profits to chance. Historically, this stock follows specific seasonal patterns that institutional traders use to maximize returns.
- ✅ Identify the "Golden Buying Window"
- ✅ Avoid high-risk correction cycles
- ✅ Backtested data from the last 20+ years