August 11, 2025 a 04:28 am

GBPCAD: Trend and Support & Resistance Analysis
The GBPCAD currency pair has undergone significant fluctuations over the past few months. Recent data suggests a move towards stabilization, although there have been times of heightened volatility. Analyzing the recent trend and identifying key support and resistance zones can provide strategic entry and exit points for traders.
Trend Analysis
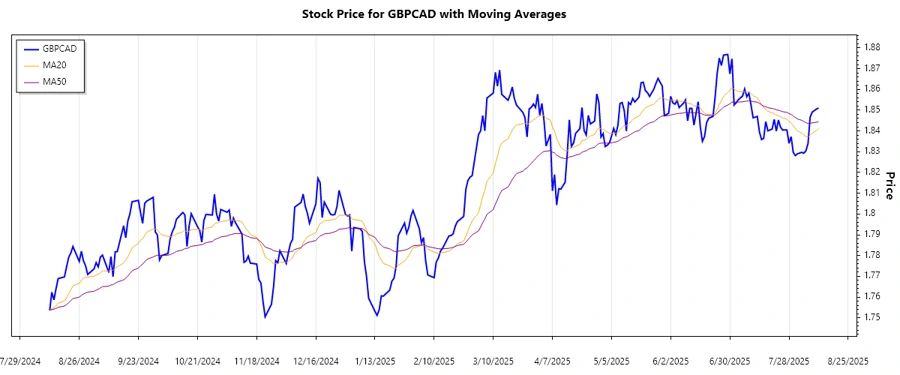
Analyzing the historical data for GBPCAD, we calculated the 20-day and 50-day exponential moving averages (EMAs) to determine the current trend of the currency pair.
| Date | Close Price | Trend |
|---|---|---|
| 2025-08-11 | 1.85104 | ▲ Uptrend |
| 2025-08-10 | 1.85052 | ▲ Uptrend |
| 2025-08-08 | 1.8491 | ▲ Uptrend |
| 2025-08-07 | 1.84663 | ▲ Uptrend |
| 2025-08-06 | 1.83391 | ▲ Uptrend |
| 2025-08-05 | 1.83042 | ▲ Uptrend |
| 2025-08-04 | 1.82929 | ▲ Uptrend |
The current trend for GBPCAD remains upward over the last week, suggesting potential bullish opportunities. Consistent EMA20 values above EMA50 indicate a strong upward momentum.
Support- and Resistance
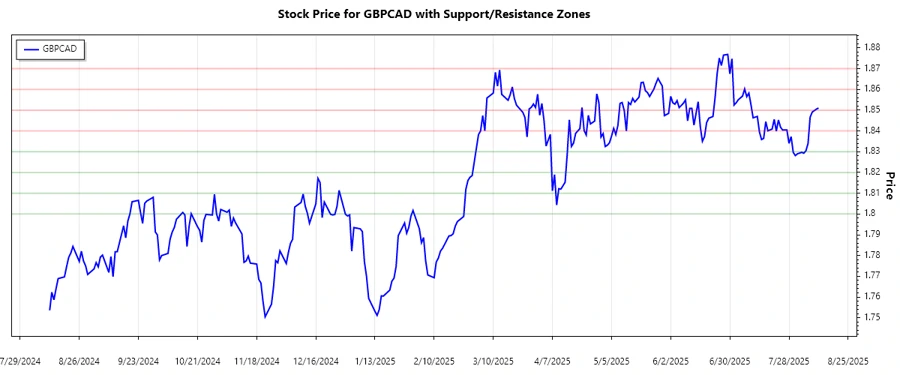
Identifying critical support and resistance zones can guide traders in better decision-making. Calculations are as follows:
| Type | From | To |
|---|---|---|
| Resistance 1 | 1.8600 | 1.8700 |
| Resistance 2 | 1.8400 | 1.8500 |
| Support 1 | 1.8200 | 1.8300 |
| Support 2 | 1.8000 | 1.8100 |
The current price is nestled within the first resistance zone, indicating potential price reversal or continued breakout.
Conclusion
The GBPCAD pair is currently experiencing a bullish trajectory, with prices gravitating towards defined resistance zones. Traders should note the upward trend but remain aware of possible reversals near resistance levels. For those considering long positions, maintaining awareness of the support levels for potential exits is crucial. Given the existing volatility, risk management strategies are essential for capital protection.
Smart Data Insight
Master the Perfect Entry & Exit for this Stock
Don't leave your profits to chance. Historically, this stock follows specific seasonal patterns that institutional traders use to maximize returns.
- ✅ Identify the "Golden Buying Window"
- ✅ Avoid high-risk correction cycles
- ✅ Backtested data from the last 20+ years