February 19, 2026 a 04:28 am

GBPAUD: Trend and Support & Resistance Analysis
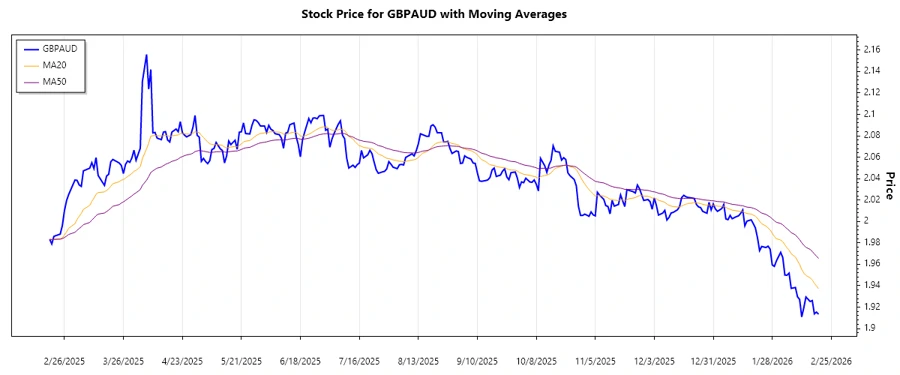
The GBPAUD currency pair has recently shown signs of a downtrend, with prices slipping below key moving averages. The recent data suggests bearish momentum, as investors grapple with changing market conditions. Identifying the proper support and resistance levels will be crucial in anticipating future movements and potential reversals.
Trend Analysis
The analysis of the GBPAUD over the past months shows a prevailing downtrend. Calculations of the EMA20 and EMA50 from the closing prices reveal an EMA20 below the EMA50, indicating ▼ bearish trend momentum.
| Date | Close Price | Trend |
|---|---|---|
| 2026-02-19 | 1.91341 | 🔻 |
| 2026-02-18 | 1.91538 | 🔻 |
| 2026-02-17 | 1.91373 | 🔻 |
| 2026-02-16 | 1.92616 | 🔻 |
| 2026-02-15 | 1.92529 | 🔻 |
| 2026-02-13 | 1.92949 | ⚖️ |
| 2026-02-12 | 1.91956 | ⚖️ |
The consistent positioning of the EMA20 under the EMA50 supports the view of a sustained downtrend, indicating potential further declines unless upcoming trade data shifts the trend dynamics.
Support and Resistance
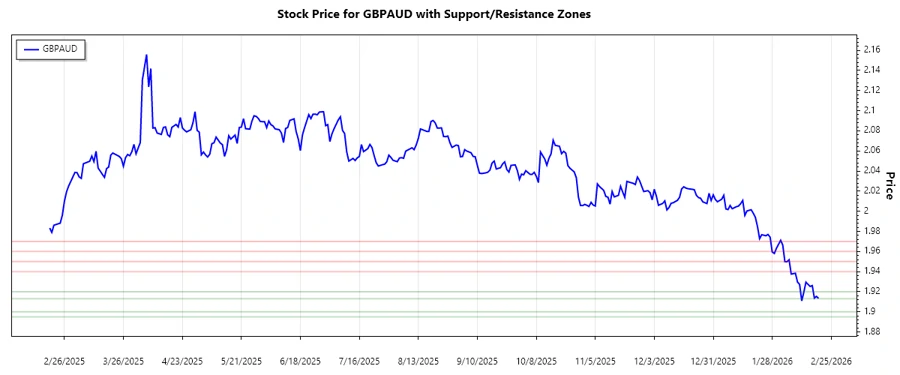
The identification of support and resistance zones highlights key areas where price reversals might occur. Based on historical data analysis, potential support and resistance levels are as follows:
| Zone Type | From | To |
|---|---|---|
| Support Zone 1 | 1.91300 | 1.92000 |
| Support Zone 2 | 1.89500 | 1.90000 |
| Resistance Zone 1 | 1.94000 | 1.95000 |
| Resistance Zone 2 | 1.96000 | 1.97000 |
Currently, the GBPAUD is residing within the Support Zone 1 range, emphasizing the critical need to monitor market movements that could either propel a reversal or a deep dive beyond this zone.
Conclusion
The GBPAUD pair's recent descent below critical moving averages signals a bearish outlook, with risks of further depreciation should the downtrend persist. The strategic identification of support and resistance levels offers potential turning points for analysts to watch. While the current market sentiment leans bearish, volatile economic indicators could quickly alter this trajectory, offering both opportunities and risks for traders.