February 02, 2026 a 04:28 am
GBPAUD: Trend and Support & Resistance Analysis
The GBPAUD currency pair has shown diverse movements over the past months. Its recent fluctuations depict both potential growth opportunities and risks. As traders, identifying trends and key levels will be essential in strategizing future trades effectively.
Trend Analysis
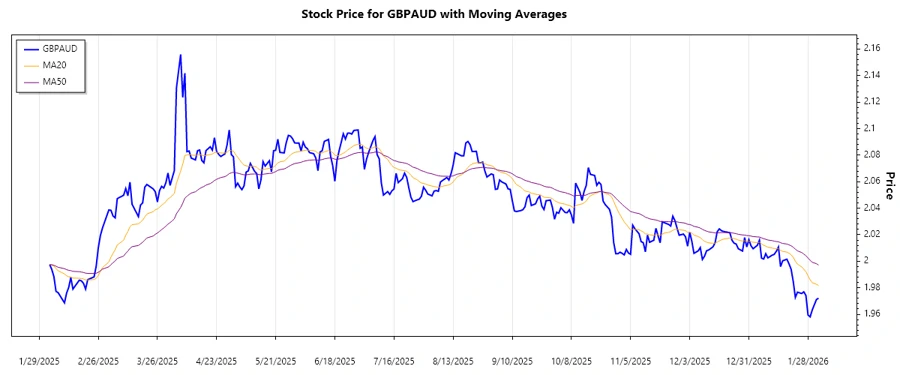
The GBPAUD currency pair demonstrates a series of ups and downs, with the calculated EMA20 standing at 1.9835 and EMA50 at 1.9942. This signifies a ▼ Abwärtstrend as EMA20 is less than EMA50. Here's a detailed look at the most recent data:
| Date | Closing Price | Trend |
|---|---|---|
| 2026-02-02 | 1.97209 | ▼ |
| 2026-02-01 | 1.97119 | ▼ |
| 2026-01-30 | 1.96322 | ▼ |
| 2026-01-29 | 1.95805 | ▼ |
| 2026-01-28 | 1.95947 | ▼ |
| 2026-01-27 | 1.97421 | ▼ |
| 2026-01-26 | 1.97694 | ▼ |
The ongoing ▼ Abwärtstrend signifies caution. Traders are advised to be vigilant, considering potential consolidations or revisions in strategy.
Support- and Resistance
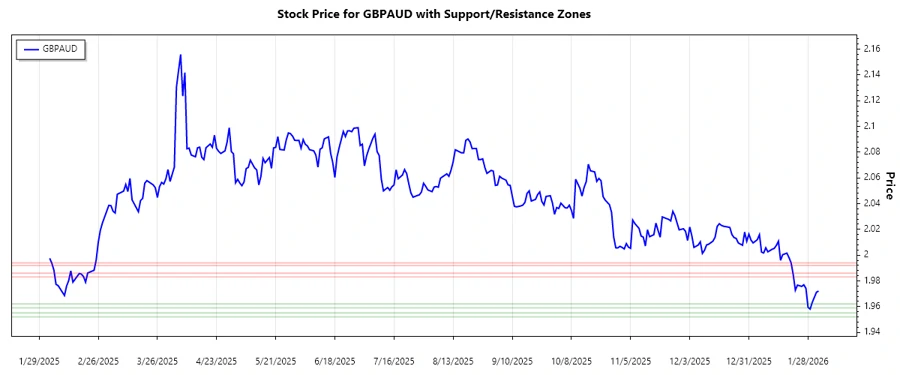
Key support and resistance levels determine strategic entry and exit points in trading. For the GBPAUD, critical levels have been identified:
| Zone Type | From | To |
|---|---|---|
| Support | 1.959 | 1.962 |
| Support | 1.952 | 1.955 |
| Resistance | 1.983 | 1.986 |
| Resistance | 1.992 | 1.994 |
Current levels indicate that the price is approaching a support zone. It is important to watch for buying opportunities if certain trigger points among these levels are confirmed.
Conclusion
The GBPAUD currency pair is showcasing a technical ▼ Abwärtstrend, with vital support zones nearly tested. Analysts need to carefully evaluate both fundamental factors and technical data before making decisions. The support levels suggest possible entry points for long positions, while the resistance zones flag areas for potential pullbacks or profit taking. However, the continuous pressure might hint at longer-term bearish movements unless reversed. As always, a robust risk management strategy remains crucial.