January 18, 2026 a 04:28 am


GBPAUD: Trend and Support & Resistance Analysis
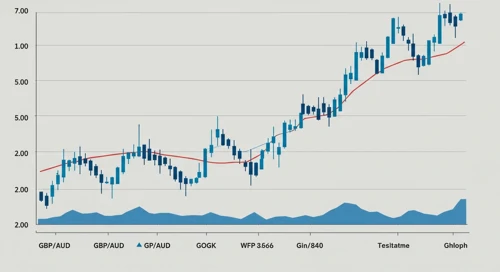
The currency pair GBPAUD has exhibited a slight downward trend in recent times. The analysis reveals pivotal support and resistance levels that may dictate future movements. Stability concerns in the global market influence the current trajectory, leading to cautious trading behavior. Anticipating market shifts at these technical zones is crucial for traders.
Trend Analysis
| Date | Close Price | Trend |
|---|---|---|
| 2026-01-16 | 2.00034 | ▼ |
| 2026-01-15 | 1.99593 | ▼ |
| 2026-01-14 | 2.01078 | ▲ |
| 2026-01-13 | 2.00753 | ⚖️ |
| 2026-01-12 | 2.00521 | ▲ |
| 2026-01-11 | 2.00456 | ⚖️ |
| 2026-01-09 | 2.00254 | ▲ |
The analysis indicates a current downtrend driven by the EMA20 crossing below the EMA50. This signifies bearish moves dominating the market sentiment.
Support and Resistance
| Type | Zone From | Zone To |
|---|---|---|
| Resistance 1 | 2.02200 | 2.02440 |
| Resistance 2 | 2.03000 | 2.03400 |
| Support 1 | 1.99500 | 2.00000 |
| Support 2 | 1.98000 | 1.98500 |
Currently, the GBPAUD is trading within the primary support zone, indicating potential rebound or further declines testing the deeper support levels. Traders should monitor these areas for signs of reversal.
Conclusion
The GBPAUD's current technical outlook shows a prevailing bearish pressure, with critical support being tested. The downward EMA crossover further acknowledges this sentiment. Traders should consider the close proximity to support zones which might usher intermittent rebounds. However, failure to hold the support could mean further declines. The risk of increased volatility remains, thereby demanding caution among traders and investors. Observing these technical zones is crucial for assessing potential breakout opportunities.
JSON Representation: