August 19, 2025 a 04:29 am
GBPAUD: Trend and Support & Resistance Analysis
GBPAUD has shown fluctuations in recent months, exhibiting both bullish and bearish phases. As of the latest data, despite a temporary dip, there's a noticeable upward movement, suggesting a potential positive shift. Technical indicators point towards a developing trend that may influence short-term investment decisions. Analysts should monitor market news as external factors could play a significant role in future movements.
Trend Analysis
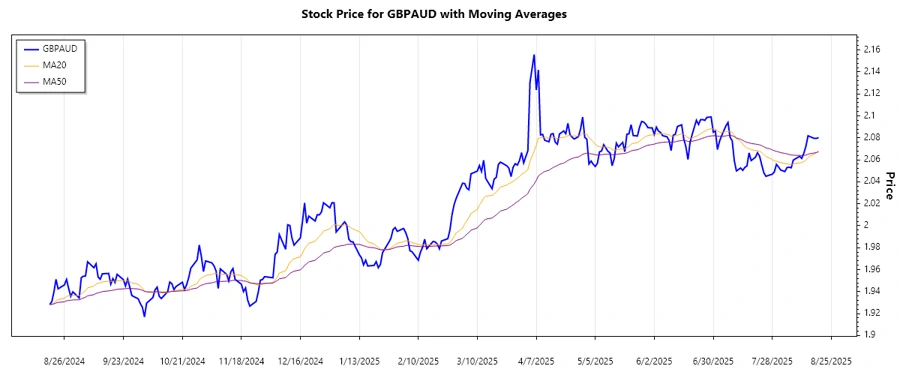
The recent trend for GBPAUD indicates potential growth, particularly over the past weeks. When comparing the calculated EMAs, the EMA20 (short-term) has been consistently above the EMA50 (long-term), confirming an upward trend.
| Date | Close Price | Trend |
|---|---|---|
| 2025-08-19 | 2.08027 | ▲ |
| 2025-08-18 | 2.07947 | ▲ |
| 2025-08-17 | 2.07945 | ▲ |
| 2025-08-15 | 2.08107 | ▲ |
| 2025-08-14 | 2.08187 | ▲ |
| 2025-08-13 | 2.07249 | ▼ |
| 2025-08-12 | 2.06604 | ▼ |
The table illustrates a consistent upward trend, with a slight dip mid-cycle. This position indicates bullish momentum with possible continued growth.
Support and Resistance
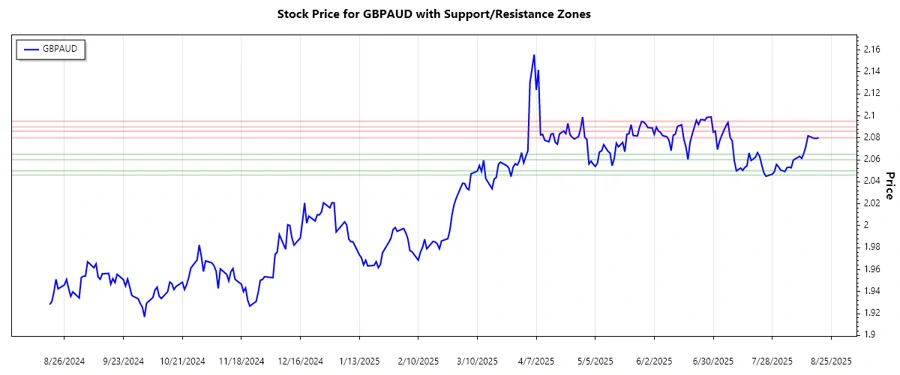
By assessing the historical data, two primary support and resistance zones are identified. These zones provide investors insights into potential price bounds.
| Zone Type | From | To |
|---|---|---|
| Support Zone 1 | 2.0600 | 2.0650 |
| Support Zone 2 | 2.0460 | 2.0500 |
| Resistance Zone 1 | 2.0800 | 2.0860 |
| Resistance Zone 2 | 2.0900 | 2.0950 |
Currently, the GBPAUD is oscillating near the first resistance zone, indicating that any breach could lead to further bullish movements.
Conclusion
The GBPAUD exchange rate displays a potential for continued upward movement. With its current position within a resistance zone, a breakthrough could signal a strong bullish market. However, investors must consider the geopolitical and economic factors impacting these exchange rates. While there are opportunities for gains, the volatility also poses risks, necessitating constant monitoring.
Smart Data Insight
Master the Perfect Entry & Exit for this Stock
Don't leave your profits to chance. Historically, this stock follows specific seasonal patterns that institutional traders use to maximize returns.
- ✅ Identify the "Golden Buying Window"
- ✅ Avoid high-risk correction cycles
- ✅ Backtested data from the last 20+ years