
July 19, 2026 a 05:08 am
GBPAUD: Fibonacci Analysis
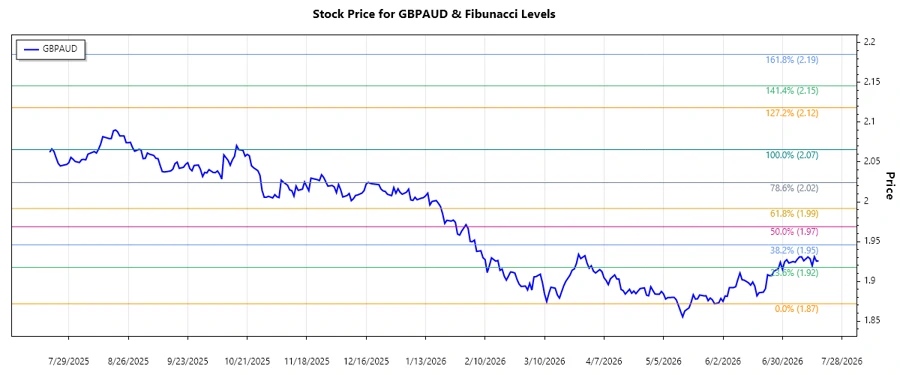
The GBPAUD currency pair has seen significant movements over the past few months. The recent trend indicates a strong upward movement, which has been dominant since mid-April. This bullish trend suggests market confidence in the British Pound compared to the Australian Dollar, potentially influenced by differing economic conditions or monetary policies between the UK and Australia. As we dive deeper into the Fibonacci retracement levels, we will assess potential price corrections within this upward trend.
Fibonacci Analysis
The long-term analysis of the GBPAUD has identified a clear upward trend from April 1, 2025, to July 17, 2026, marked by a high price of 2.06553 and a low price of 1.87172. Applying Fibonacci retracement to this trend helps us to identify potential support and resistance levels.
| Detail | Value |
|---|---|
| Start Date | 2025-04-01 |
| End Date | 2026-07-17 |
| High Price | 2.06553 (2025-10-17) |
| Low Price | 1.87172 (2026-05-29) |
Fibonacci Levels
| Level | Price |
|---|---|
| 0.236 | 1.92351 |
| 0.382 | 1.96244 |
| 0.5 | 1.98980 |
| 0.618 | 2.01716 |
| 0.786 | 2.05717 |
The current price is 1.92565, which is in the 0.236 retracement zone, suggesting a potential support level.
Technically, this indicates that a consolidation or minor pullback could be observed, providing potential buying opportunities before another upward move.
Conclusion
The GBPAUD currency pair has demonstrated a strong bullish trend over several months. The presence of supportive Fibonacci levels reinforces potential upward momentum unless a significant economic event triggers a reversal. Analysts should consider the 0.236 retracement as a crucial support level. The overall market sentiment appears optimistic, but traders should remain cautious of geopolitical events that could impact currency value. As with any financial analysis, monitoring for confirming signals before acting is advisable.
Smart Data Insight
Master the Perfect Entry & Exit for this Stock
Don't leave your profits to chance. Historically, this stock follows specific seasonal patterns that institutional traders use to maximize returns.
- ✅ Identify the "Golden Buying Window"
- ✅ Avoid high-risk correction cycles
- ✅ Backtested data from the last 20+ years