May 08, 2026 a 05:08 am
GBPAUD: Fibonacci Analysis
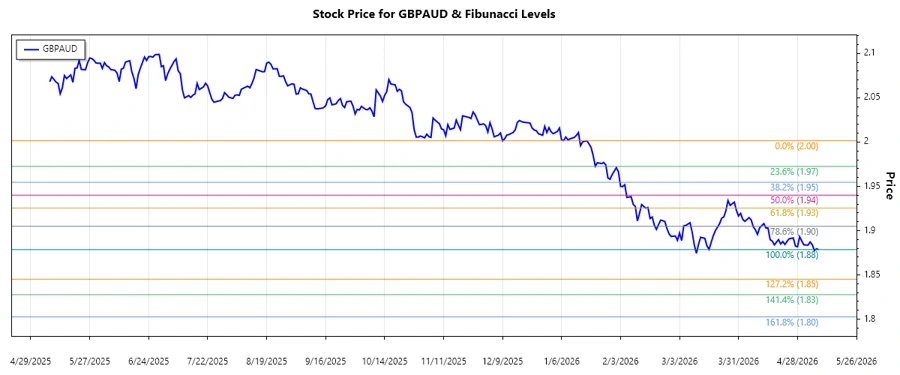
The GBPAUD currency pair has been experiencing a notable downtrend over the past several months. This trend is primarily influenced by macroeconomic factors such as interest rate differentials and economic performance projections between the UK and Australia. The volatility witnessed has created multiple trading opportunities but also highlighted the risks associated with currency trading.
Fibonacci Analysis
| Trend Start Date | Trend End Date | Highest Point (Price and Date) | Lowest Point (Price and Date) | Fibonacci Levels | Current Price | Retracement Zone | Technical Interpretation |
|---|---|---|---|---|---|---|---|
| 2026-01-18 | 2026-05-08 | 2.00153 on 2026-01-18 | 1.87859 on 2026-05-08 |
|
1.87859 | none | The current price is below the 0.236 Fibonacci level, indicating the absence of a significant retracement. This suggests a continuation of the downtrend with potential support forming around the recent low. |
Conclusion
The GBPAUD currency pair is currently in a pronounced downtrend that appears poised to continue unless a retracement begins. Traders should be cautious of potential breakouts and be prepared for additional downside risk if support levels fail. Fibonacci levels suggest potential zones of resistance should a reversal occur. Analysts should closely monitor economic indicators from both the UK and Australia that could affect currency performance.
Smart Data Insight
Master the Perfect Entry & Exit for this Stock
Don't leave your profits to chance. Historically, this stock follows specific seasonal patterns that institutional traders use to maximize returns.
- ✅ Identify the "Golden Buying Window"
- ✅ Avoid high-risk correction cycles
- ✅ Backtested data from the last 20+ years