September 15, 2025 a 05:08 am
GBPAUD: Fibonacci Analysis
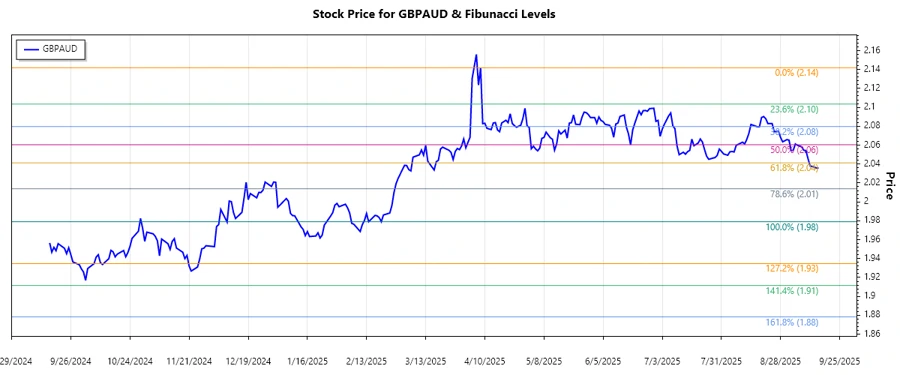
The GBPAUD currency pair has shown significant movements over the past few months. Driven by various macroeconomic factors, the recent trend has been characterized predominantly by declining prices, indicating a strong bearish sentiment. Investors are advised to pay close attention to this trend as it develops further in the coming weeks.
Fibonacci Analysis
The data provided shows a dominant downtrend in the GBPAUD currency pair from April 8, 2025, to September 15, 2025. During this period, the pair reached a high of 2.14188 on April 8, 2025, and fell to a low of 1.97900 on February 20, 2025. Based on this downtrend, the following Fibonacci retracement levels have been calculated:
| Level | Price |
|---|---|
| 0.236 | 2.03902 |
| 0.382 | 2.05514 |
| 0.5 | 2.06544 |
| 0.618 | 2.07574 |
| 0.786 | 2.09050 |
The current price of 2.03574 is found below the 0.236 retracement level, indicating that the pair may continue to experience downward momentum with potential support near the recent low.
This suggests the possibility of further declines unless there is significant buying interest that pushes the price back above the 0.236 level. Should the price retrace back, the levels identified can act as potential resistance.
Conclusion
The analysis of the GBPAUD reveals a clear downtrend, offering both opportunities and risks for traders and investors. Taking advantage of potential downtrends requires careful monitoring of key levels for possible reversals. Fibonacci retracement levels can serve as crucial indicators for identifying potential bounce-back points or confirming the strength of the trend. As the market reacts to economic and geopolitical developments, staying updated on these dynamics can provide strategic entry and exit points.
Smart Data Insight
Master the Perfect Entry & Exit for this Stock
Don't leave your profits to chance. Historically, this stock follows specific seasonal patterns that institutional traders use to maximize returns.
- ✅ Identify the "Golden Buying Window"
- ✅ Avoid high-risk correction cycles
- ✅ Backtested data from the last 20+ years