April 30, 2026 a 03:12 pm


Financial Stocks - Performance Analysis
In a volatile financial market landscape, the performance of major financial stocks has shown diverse trends across varying timeframes. A comprehensive analysis of weekly, monthly, and quarterly performances provides insights into the sectors' resilience and challenges. The distinctive volatility in this sector underscores the dynamic interplay of market forces and the strategic responses of industry leaders.
📊 Financial Stocks Performance One Week
The one-week analysis reveals significant variance in stock performance, with VISA leading with a strong positive surge of 8.39%. MasterCard follows as another strong performer, while American Express slightly dipped. Performance differences reflect immediate market reactions to economic data or corporate announcements, indicating short-term market sentiment.
| Stock | Performance (%) | Performance |
|---|---|---|
| VISA | 8.39 | |
| MA | 4.51 | |
| WFC | 1.27 | |
| BRK.B | 1.03 | |
| BAC | 0.79 | |
| AXP | -0.88 | |
| JPM | -0.77 | |
| PGR | -2.27 | |
| SPGI | -1.33 | |
| GS | -2.75 |
📊 Financial Stocks Performance One Month
Over the past month, VISA maintained its leadership position with a 10.67% rise. Notably, Bank of America also showcased a remarkable increase, reinforcing the resilience of credit-related stocks during this period. The differential in monthly returns highlights longer-term market adjustments and corporate performance strategies.
| Stock | Performance (%) | Performance |
|---|---|---|
| VISA | 10.67 | |
| BAC | 8.29 | |
| GS | 7.11 | |
| JPM | 5.15 | |
| MA | 5.15 | |
| AXP | 4.56 | |
| WFC | 2.72 | |
| SPGI | 2.06 | |
| PGR | 1.46 | |
| BRK.B | -0.74 |
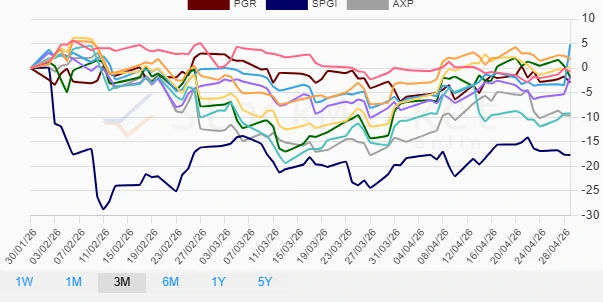
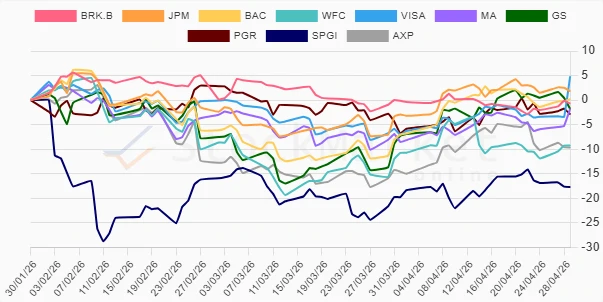
📊 Financial Stocks Performance Three Months
Over the three-month period, significant underperformance affected several stocks, with S&P Global and American Express experiencing notable drops. VISA again leads with a positive return, highlighting consistent investor confidence in this payment sector leader.
| Stock | Performance (%) | Performance |
|---|---|---|
| VISA | 4.84 | |
| JPM | 1.82 | |
| BAC | 0.20 | |
| BRK.B | -0.73 | |
| MA | -1.77 | |
| GS | -1.81 | |
| PGR | -2.90 | |
| WFC | -9.26 | |
| AXP | -9.67 | |
| SPGI | -17.68 |
🔍 Summary
The financial stocks have demonstrated significant variability, with VISA showing consistent strength across all periods. The sector faces ongoing challenges, as seen by the declines in SPGI and AXP. Investors should remain vigilant, focusing on market leaders and monitoring underperformance for potential turnaround opportunities.