
October 29, 2026 a 03:12 pm


Financial Stocks - Performance Analysis
📊 The financial sector has exhibited varying performances across different timeframes as economic conditions continue to fluctuate. 📉 Recent data provides insight into both stable and volatile stock movements within this critical sector. Now, let's delve into the performance details spanning one week, one month, and three months. 🗣️ Understanding these patterns helps investors make informed decisions amidst market dynamics.
Financial Stocks Performance One Week
📈 Over the past week, certain stocks within the financial sector have shown marked changes. Goldman's Sachs stands out as a top performer with a gain of 3.80%, while Mastercard experienced a downturn with a substantial loss of 3.65%. These trends indicate significant volatility, highlighting the dynamic nature of financial markets.
| Stock | Performance (%) | Performance |
|---|---|---|
| GS | 3.80 | |
| JPM | 0.84 | |
| WFC | 0.80 | |
| BAC | -0.44 | |
| SPGI | -0.83 | |
| BRK.B | -1.21 | |
| PGR | -1.72 | |
| AXP | -2.17 | |
| VISA | -3.35 | |
| MA | -3.65 |
Financial Stocks Performance One Month
📉 Over the past month, SPGI has demonstrated exceptional growth with an impressive 13.73% increase, leading the financial sector. In contrast, Bank of America struggled, reflecting a 7.57% decline, pointing to sector-specific challenges and opportunities. 🔍 This period captures a broad spectrum of market sentiments impacting financial securities.
| Stock | Performance (%) | Performance |
|---|---|---|
| SPGI | 13.73 | |
| VISA | 9.25 | |
| MA | 8.11 | |
| BRK.B | 7.35 | |
| PGR | 7.25 | |
| AXP | 4.17 | |
| WFC | 4.09 | |
| JPM | 1.35 | |
| GS | 1.17 | |
| BAC | -7.57 |
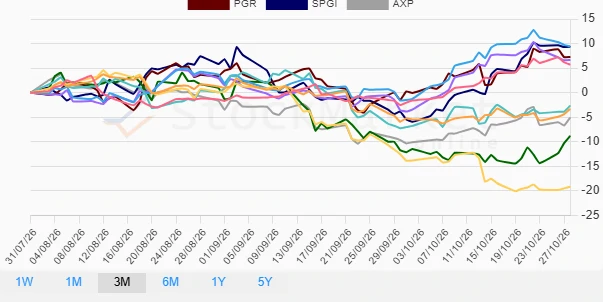
Financial Stocks Performance Three Months
✅ In a three-month overview, Visa and SPGI have both demonstrated robust performance with gains over 9%. Conversely, Bank of America has encountered significant difficulties, plummeting by 19.16%. 📉 Such disparities highlight the underlying volatility and potential within the sector for investors.
| Stock | Performance (%) | Performance |
|---|---|---|
| VISA | 9.42 | |
| SPGI | 9.37 | |
| PGR | 7.26 | |
| MA | 6.67 | |
| BRK.B | 5.70 | |
| WFC | -2.65 | |
| AXP | -5.08 | |
| JPM | -3.33 | |
| GS | -8.82 | |
| BAC | -19.16 |
Summary
💡 In conclusion, the financial sector exhibits varied yet pronounced trends. While stocks like SPGI and Visa have consistently achieved high returns, others such as Bank of America highlight underlying vulnerabilities. Investors should consider both macroscopic trends and sector-specific performances to strategize their portfolios effectively. Despite short-term volatilities, long-term diversification is key to leveraging opportunities within the financial sector. 🏦
Smart Data Insight
Master the Perfect Entry & Exit for this Stock
Don't leave your profits to chance. Historically, this stock follows specific seasonal patterns that institutional traders use to maximize returns.
- ✅ Identify the "Golden Buying Window"
- ✅ Avoid high-risk correction cycles
- ✅ Backtested data from the last 20+ years