August 28, 2025 a 03:12 pm


Financial Stocks - Performance Analysis
Financial stocks have demonstrated varied performance metrics over short-term periods, reflecting both market volatility and sector-specific conditions. With diverse returns across different companies, analysis of these time frames provides insight into investor sentiment and market dynamics. By evaluating performance over weekly, monthly, and quarterly periods, a comprehensive view of financial sector adjustments is established.
📊 Financial Stocks Performance One Week
The one-week performance data showcases resilience among financial stocks, with a range of positive to slightly negative returns. Wells Fargo (WFC) led the way with significant gains, while Progressive Corporation (PGR) underperformed. This suggests a short-term bullish sentiment in the sector, potentially driven by specific company news or broader market conditions.
| Stock | Performance (%) | Performance |
|---|---|---|
| WFC | 5.87 | |
| GS | 4.68 | |
| AXP | 4.62 | |
| BAC | 4.35 | |
| JPM | 2.67 | |
| VISA | 1.94 | |
| BRK.B | 1.45 | |
| MA | -0.20 | |
| SPGI | -0.46 | |
| PGR | -1.70 |
📊 Financial Stocks Performance One Month
Over a one-month period, most financial stocks reported positive growth, with Bank of America (BAC) and American Express (AXP) leading the pack. Some stocks, like Visa, had marginal declines, indicating variability in investor confidence.
| Stock | Performance (%) | Performance |
|---|---|---|
| BAC | 5.18 | |
| AXP | 4.64 | |
| MA | 4.83 | |
| BRK.B | 4.05 | |
| SPGI | 3.69 | |
| GS | 2.60 | |
| PGR | 1.46 | |
| JPM | 0.88 | |
| WFC | 0.08 | |
| VISA | -0.14 |
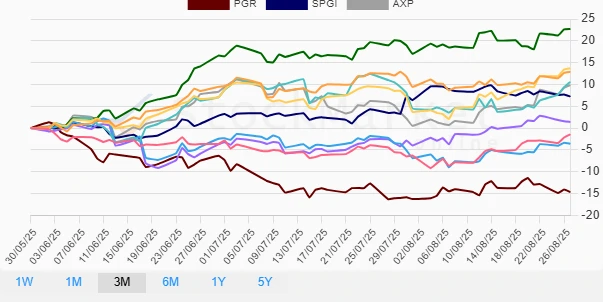
📊 Financial Stocks Performance Three Months
The quarterly performance reveals broader trends with Goldman Sachs (GS) and JPMorgan Chase (JPM) delivering substantial gains, while Progressive Corporation (PGR) faced significant losses. Such divergences may point to strategic shifts or differentiated investor perceptions within the sector.
| Stock | Performance (%) | Performance |
|---|---|---|
| GS | 22.72 | |
| BAC | 13.71 | |
| JPM | 12.91 | |
| WFC | 10.56 | |
| AXP | 9.85 | |
| SPGI | 7.25 | |
| MA | 1.42 | |
| BRK.B | -1.45 | |
| VISA | -3.59 | |
| PGR | -14.63 |
Summary
The financial sector showcased mixed performance over different time frames, with certain stocks displaying strong growth potential while others faced challenges. This analysis underscores the importance of strategic stock selection within the sector, leveraging short-term trends for optimal portfolio alignment. Evaluating these trends provides investors actionable insights to navigate potential market shifts.
Smart Data Insight
Master the Perfect Entry & Exit for this Stock
Don't leave your profits to chance. Historically, this stock follows specific seasonal patterns that institutional traders use to maximize returns.
- ✅ Identify the "Golden Buying Window"
- ✅ Avoid high-risk correction cycles
- ✅ Backtested data from the last 20+ years