June 25, 2026 a 03:12 pm


Financial Stocks - Performance Analysis
📊 The financial sector has experienced a dynamic period over the past week, month, and quarter. Within this realm, the performance varies significantly across major stocks, indicating shifting investor sentiment and market conditions. This analysis delves into the performance of notable stocks such as JPMorgan, Bank of America, and Goldman Sachs, providing crucial insights and trends that define their short-term and long-term prospects.
Financial Stocks Performance One Week
🔍 Over the past week, Progressive Corporation (PGR) emerged as the top performer with a notable gain, while S&P Global (SPGI) underperformed. The overall trend displays a mix of positive and negative performances, with most stocks showing modest gains amidst fluctuating market conditions.
| Stock | Performance (%) | Performance |
|---|---|---|
| PGR | 7.47% | |
| BAC | 2.71% | |
| WFC | 2.55% | |
| JPM | 2.51% | |
| AXP | 1.35% | |
| VISA | 1.52% | |
| BRK.B | 1.09% | |
| MA | 0.96% | |
| GS | -1.79% | |
| SPGI | -2.08% |
📈 Chart illustrating weekly performance of financial stocks.
Financial Stocks Performance One Month
🔍 Upon examining the monthly performance, Progressive Corporation (PGR) has again outshined, while S&P Global (SPGI) remains the underperformer. The broader financial sector demonstrated significant growth, particularly driven by Bank of America and American Express, indicating bullish sentiment and sectoral strength over the past month.
| Stock | Performance (%) | Performance |
|---|---|---|
| PGR | 10.70% | |
| BAC | 10.25% | |
| AXP | 10.05% | |
| JPM | 8.64% | |
| WFC | 8.62% | |
| GS | 8.48% | |
| BRK.B | 2.34% | |
| VISA | 1.91% | |
| MA | 0.50% | |
| SPGI | -2.19% |
📈 Chart demonstrating monthly performance of financial stocks.
Financial Stocks Performance Three Months
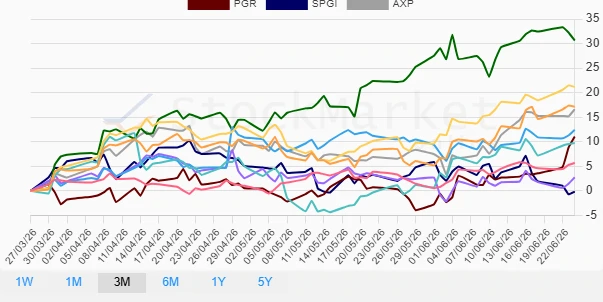
🔍 Observing the three-month horizon, Goldman Sachs has outperformed remarkably, followed by significant gains from Bank of America and JP Morgan. This period showcases the resilience and appeal of financial stocks, with a general trend of recovery and growth, albeit with a few underperformers like SPGI.
| Stock | Performance (%) | Performance |
|---|---|---|
| GS | 30.65% | |
| BAC | 21.17% | |
| JPM | 17.15% | |
| AXP | 16.59% | |
| VISA | 12.41% | |
| PGR | 11.04% | |
| WFC | 9.74% | |
| BRK.B | 5.68% | |
| MA | 2.73% | |
| SPGI | -0.16% |
📈 Chart showcasing three-month performance of financial stocks.
Summary
💡 Over the analyzed periods, the financial sector has demonstrated dynamic movements with clear leaders and underperformers across different timelines. Goldman Sachs' recent quarterly performance suggests strong investor confidence, while Progressive Corporation remains consistent across shorter time frames. S&P Global's persistent underperformance across all periods may signal challenges that need strategic addressing. Investors should consider these trends in the context of their broader investment strategies, acknowledging the sector's potent volatility and growth opportunities.
Smart Data Insight
Master the Perfect Entry & Exit for this Stock
Don't leave your profits to chance. Historically, this stock follows specific seasonal patterns that institutional traders use to maximize returns.
- ✅ Identify the "Golden Buying Window"
- ✅ Avoid high-risk correction cycles
- ✅ Backtested data from the last 20+ years