
July 23, 2026 a 03:12 pm

Financial Stocks - Performance Analysis
The financial sector has experienced varying degrees of performance across different timeframes, reflecting the dynamic nature of market forces. Identifying top-performing stocks and those that have underperformed helps investors make informed decisions. This analysis focuses on the performance over 1 week, 1 month, and 3 months, highlighting trends and insights.
Financial Stocks Performance One Week
🗣️ Over the past week, the financial sector has seen substantial volatility, with some stocks experiencing considerable declines, notably in companies like SPGI, AXP, VISA, and MA. In contrast, JPM has emerged as the leading performer, showing resilience amidst market fluctuations.
| Stock | Performance (%) | Performance |
|---|---|---|
| JPM | 1.49 | |
| GS | 0.33 | |
| BAC | 0.22 | |
| PGR | -0.54 | |
| BRK.B | -0.76 | |
| WFC | -1.86 | |
| VISA | -3.23 | |
| MA | -3.57 | |
| AXP | -3.58 | |
| SPGI | -6.30 |
Financial Stocks Performance One Month
📈 Over the monthly horizon, financial stocks demonstrate a more optimistic trajectory. Notably, MA leads with the highest performance, followed closely by VISA and SPGI. Most stocks showed positive growth, with PGR being the exception at a loss.
| Stock | Performance (%) | Performance |
|---|---|---|
| MA | 8.89 | |
| VISA | 7.57 | |
| SPGI | 7.46 | |
| BAC | 6.37 | |
| AXP | 3.46 | |
| JPM | 4.27 | |
| WFC | 2.94 | |
| GS | 1.17 | |
| BRK.B | -0.60 | |
| PGR | -4.43 |
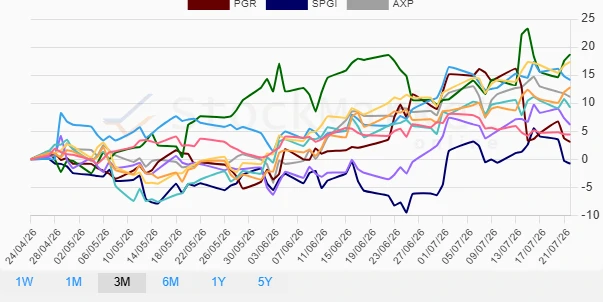
Financial Stocks Performance Three Months
🔍 In the three-month span, financial stocks exhibit a strong overall recovery. GS leads with the highest gain, benefitting from positive market conditions. Except for SPGI, all other stocks showed positive performance, indicating a broader sector rally.
| Stock | Performance (%) | Performance |
|---|---|---|
| GS | 18.69 | |
| BAC | 17.38 | |
| VISA | 14.13 | |
| JPM | 12.81 | |
| AXP | 11.12 | |
| WFC | 9.23 | |
| MA | 6.15 | |
| BRK.B | 4.42 | |
| PGR | 3.09 | |
| SPGI | -0.78 |
Summary
✅ The analysis across three timeframes shows a sector characterized by both challenges and opportunities. Over a week, we witnessed significant pullbacks, but monthly and quarterly performances suggest a robust recovery trajectory. Investors may consider focusing on stocks such as GS and BAC, which demonstrate consistent positive momentum. However, caution is advised as volatility remains inherent in the financial markets.
Smart Data Insight
Master the Perfect Entry & Exit for this Stock
Don't leave your profits to chance. Historically, this stock follows specific seasonal patterns that institutional traders use to maximize returns.
- ✅ Identify the "Golden Buying Window"
- ✅ Avoid high-risk correction cycles
- ✅ Backtested data from the last 20+ years