April 23, 2026 a 03:12 pm


Financial Stocks - Performance Analysis
In recent weeks, financial stocks have exhibited diverse performances, unveiling significant fluctuations across varying time horizons. While certain equities have thrived, showcasing strong gains, others have battled headwinds, impacting their valuations. The financial sector's journey over the past quarter encapsulates both opportunities and challenges, warranting a deeper dive into individual stock performances to reveal emerging trends and forecast future movements in the market.
📊 Financial Stocks Performance One Week
| Stock | Performance (%) | Performance |
|---|---|---|
| GS | 3.87 | |
| SPGI | 2.79 | |
| AXP | 2.19 | |
| JPM | 1.02 | |
| PGR | -0.33 | |
| BAC | -0.72 | |
| WFC | -0.81 | |
| VISA | -1.19 | |
| MA | -1.62 | |
| BRK.B | -2.06 |
📊 Financial Stocks Performance One Month
| Stock | Performance (%) | Performance |
|---|---|---|
| GS | 11.63 | |
| BAC | 10.08 | |
| AXP | 9.98 | |
| SPGI | 9.07 | |
| JPM | 7.07 | |
| VISA | 2.61 | |
| MA | 2.41 | |
| WFC | 1.65 | |
| PGR | -1.44 | |
| BRK.B | -2.88 |
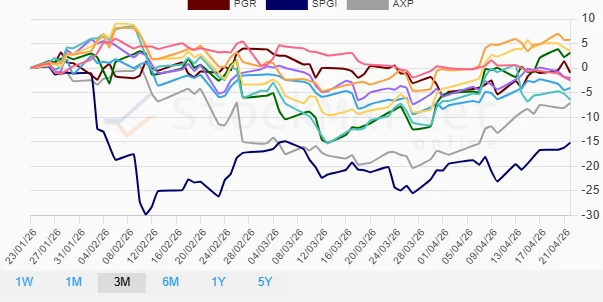
📊 Financial Stocks Performance Three Months
| Stock | Performance (%) | Performance |
|---|---|---|
| JPM | 5.75 | |
| BAC | 3.49 | |
| GS | 3.11 | |
| PGR | -0.91 | |
| MA | -2.01 | |
| BRK.B | -2.52 | |
| VISA | -4.05 | |
| WFC | -6.42 | |
| AXP | -7.13 | |
| SPGI | -15.20 |
🔍 Summary
The financial sector's recent performance underscores a landscape marked by volatility and differentiated trajectories across individual equities. Over the weekly, monthly, and quarterly horizons, stocks like GS and BAC have demonstrated resilience, buoyed by positive momentum, while SPGI and AXP have struggled to maintain upward movement, facing declines. The mixed sector performance signals a nuanced investment climate, requiring strategic insights and a vigilant approach. As the financial market continues to navigate through external pressures and macroeconomic factors, investors are advised to maintain a diversified portfolio to hedge against sector-specific uncertainties.
Smart Data Insight
Master the Perfect Entry & Exit for this Stock
Don't leave your profits to chance. Historically, this stock follows specific seasonal patterns that institutional traders use to maximize returns.
- ✅ Identify the "Golden Buying Window"
- ✅ Avoid high-risk correction cycles
- ✅ Backtested data from the last 20+ years