
October 22, 2026 a 03:12 pm


Financial Stocks - Performance Analysis
Understanding the current trends in the financial sector is crucial for investors seeking to maximize their portfolio outcomes. This analysis evaluates the top financial stocks over three distinct time frames: 1 week, 1 month, and 3 months. By examining the performance data closely, it's possible to identify the top performers, underperformers, and key market trends. Investors must stay informed to adapt their strategies according to these insights.
📊 Financial Stocks Performance One Week
The past week's performance reveals a varied landscape in the financial sector. SPGI emerged as the top performer with a 4.28% increase, showcasing significant investor confidence. On the other hand, BAC struggled, experiencing a -1.77% drop. This period highlights the importance of diversified investment strategies to manage volatility.
| Stock | Performance (%) | Performance |
|---|---|---|
| SPGI | 4.28% | |
| PGR | 3.53% | |
| AXP | 3.08% | |
| BRK.B | 2.53% | |
| VISA | 2.02% | |
| GS | 1.54% | |
| MA | 1.01% | |
| WFC | -0.36% | |
| JPM | -0.07% | |
| BAC | -1.77% |
📊 Financial Stocks Performance One Month
Over the month, VISA led with an impressive 12.09% rise followed closely by MA at 11.45%, indicating a strong performance in transaction processing firms. In contrast, BAC saw a substantial -9.92% decline, which may signal underlying concerns. This trend stresses the potential value in financial technology over more traditional banking institutions.
| Stock | Performance (%) | Performance |
|---|---|---|
| VISA | 12.09% | |
| MA | 11.45% | |
| SPGI | 9.83% | |
| PGR | 7.00% | |
| BRK.B | 6.86% | |
| AXP | 6.00% | |
| WFC | -0.64% | |
| JPM | -1.35% | |
| GS | -4.66% | |
| BAC | -9.92% |
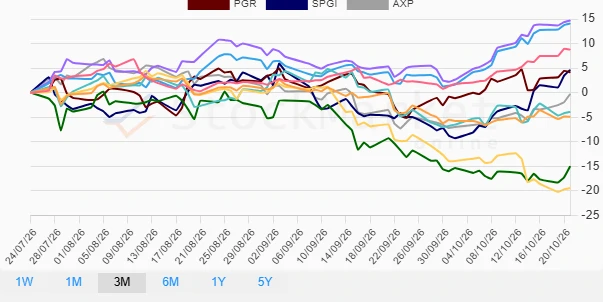
📊 Financial Stocks Performance Three Months
Quarterly analysis aligns financial stocks into two categories: VISA and MA with stellar returns of 14.08% and 14.70%, respectively, suggestive of strong market positions. Conversely, BAC's -19.43% tumble indicates deep-rooted issues that need to be addressed. This period reinforces the competitive edge of financial technology stocks.
| Stock | Performance (%) | Performance |
|---|---|---|
| MA | 14.70% | |
| VISA | 14.08% | |
| BRK.B | 8.77% | |
| SPGI | 4.63% | |
| PGR | 4.17% | |
| AXP | -0.27% | |
| WFC | -3.92% | |
| JPM | -4.89% | |
| GS | -15.00% | |
| BAC | -19.43% |
🔍 Summary
The financial sector's recent performance highlights a clear dominance by technology-driven financial enterprises, reaffirming their pivotal role in future market dynamics. VISA and MA consistently outperform, reinforcing the trend towards digital transactions. However, traditional banks like BAC and GS face formidable challenges that may require strategic pivots. The current market environment suggests a strategic emphasis on innovation and agile asset allocation.
Smart Data Insight
Master the Perfect Entry & Exit for this Stock
Don't leave your profits to chance. Historically, this stock follows specific seasonal patterns that institutional traders use to maximize returns.
- ✅ Identify the "Golden Buying Window"
- ✅ Avoid high-risk correction cycles
- ✅ Backtested data from the last 20+ years