
November 19, 2026 a 03:12 pm


Financial Stocks - Performance Analysis
Analyzing the performance of prominent financial stocks over varying time horizons offers insights into market sentiment and sector dynamics. The recent data captures the fluctuating value of financial assets, influenced by macroeconomic factors and sector-specific developments. By dissecting these trends, we can better understand the opportunities and risks within the financial sectors of the stock market.
📊 Financial Stocks Performance One Week
In the short-term span of one week, market volatility and near-term concerns have evidently played a pronounced role, as evidenced by significant declines across major financial stocks.
| Stock | Performance (%) | Performance |
|---|---|---|
| VISA | -1.18% | |
| AXP | -0.82% | |
| MA | -1.38% | |
| BRK.B | -2.59% | |
| PGR | -2.98% | |
| BAC | -3.18% | |
| GS | -4.47% | |
| SPGI | -4.74% | |
| JPM | -5.54% | |
| WFC | -5.74% |
📊 Financial Stocks Performance One Month
The one-month performance indicates a recovery among select financial stocks with both positive and negative performances observed, revealing diversification in investor responses to recent financial metrics.
| Stock | Performance (%) | Performance |
|---|---|---|
| BRK.B | 6.42% | |
| MA | 3.99% | |
| PGR | 3.17% | |
| VISA | 2.37% | |
| SPGI | 2.17% | |
| GS | -0.67% | |
| AXP | -0.67% | |
| WFC | -1.31% | |
| JPM | -3.03% | |
| BAC | -3.21% |
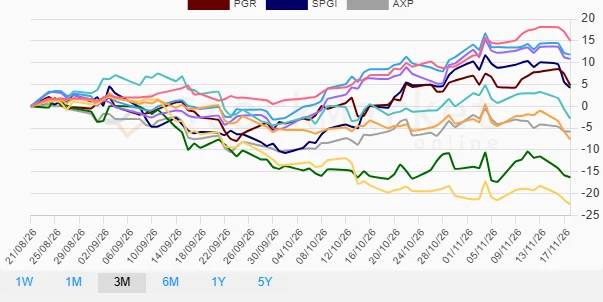
📊 Financial Stocks Performance Three Months
Over the three-month period, we observe marked differentiation in performance, with some stocks achieving considerable gains while others faced steep declines, likely reflecting broader economic signals and sectoral pressures.
| Stock | Performance (%) | Performance |
|---|---|---|
| BRK.B | 15.03% | |
| VISA | 11.84% | |
| MA | 10.87% | |
| PGR | 4.81% | |
| SPGI | 4.24% | |
| AXP | -5.80% | |
| WFC | -2.81% | |
| JPM | -7.56% | |
| GS | -16.27% | |
| BAC | -22.46% |
✅ Summary
In summary, the financial sector has showcased a dynamic range of performances across different securities over the analyzed periods. While some stocks such as BRK.B, VISA, and MA have depicted resilience with notable gains, others, particularly BAC and GS, have struggled amidst broader market challenges. These analyses underscore the importance of comprehensive market evaluation and adaptability for investors navigating these sectors.
Smart Data Insight
Master the Perfect Entry & Exit for this Stock
Don't leave your profits to chance. Historically, this stock follows specific seasonal patterns that institutional traders use to maximize returns.
- ✅ Identify the "Golden Buying Window"
- ✅ Avoid high-risk correction cycles
- ✅ Backtested data from the last 20+ years