June 19, 2025 a 03:12 pm


Financial Stocks - Performance Analysis
📊 The financial sector remains one of the most influential stock market segments. Over the past few months, it has faced both challenges and opportunities. Recent data reflects mixed performances influenced by macroeconomic factors and sector-specific developments. In this analysis, we will delve into the weekly, monthly, and quarterly performances to identify top gainers and notable trends.
Financial Stocks Performance One Week
🔍 During the last week, the financial sector exhibited both resilience and volatility. Factors such as interest rate expectations and earnings reports influenced stock movements. Notably, JPMorgan Chase stood out with a substantial gain, while Mastercard and Visa experienced significant declines.
| Stock | Performance (%) | Performance |
|---|---|---|
| JPM | 2.15% | |
| GS | 1.67% | |
| WFC | 1.06% | |
| BAC | 1.01% | |
| AXP | -0.44% | |
| SPGI | -0.64% | |
| BRK.B | -1.06% | |
| PGR | -3.04% | |
| VISA | -8.46% | |
| MA | -8.69% |
📈 The decline of Visa and Mastercard is notable, likely affected by adverse economic indicators and investor sentiment shifts.
Financial Stocks Performance One Month
🗣️ Over the past month, the stocks in the financial sector showed mixed results. Goldman Sachs led with impressive gains, reflecting strategic investments and favorable market conditions. Progressive, however, faced challenges, marking significant declines.
| Stock | Performance (%) | Performance |
|---|---|---|
| GS | 4.78% | |
| JPM | 3.16% | |
| BAC | 0.97% | |
| AXP | 0.32% | |
| WFC | -0.86% | |
| SPGI | -3.89% | |
| BRK.B | -4.71% | |
| VISA | -7.15% | |
| MA | -7.23% | |
| PGR | -9.09% |
📉 The contrast between Goldman Sachs and Progressive highlights the diverse forces at play in the financial services industry, from investment gains to underwriting losses.
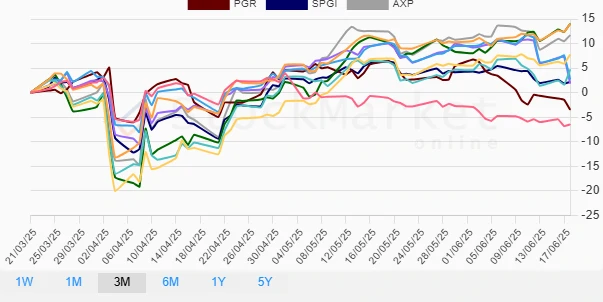
Financial Stocks Performance Three Months
✅ The quarterly assessment reveals a thriving period for some financial stocks. Goldman Sachs, with its judicious strategies, recorded remarkable growth. Conversely, Berkshire Hathaway and Progressive faced headwinds, indicating specific firm-level challenges or broader market trends.
| Stock | Performance (%) | Performance |
|---|---|---|
| GS | 14.04% | |
| JPM | 14.02% | |
| AXP | 11.71% | |
| BAC | 7.77% | |
| WFC | 4.70% | |
| VISA | 2.73% | |
| SPGI | 2.17% | |
| MA | 1.89% | |
| PGR | -3.48% | |
| BRK.B | -6.48% |
📈 This period underscores the dominance of strategic investments in propelling financial stock growth, with GS and JPM leading the charge.
Summary
💡 In conclusion, the financial sector has demonstrated a dynamic range of performances over the short and medium terms. Goldman Sachs consistently outperformed across each timeframe, highlighting its leadership in the sector, while other stocks such as Progressive and Berkshire Hathaway faced hurdles. Investors may find opportunity in robust performers like GS and JPM, but should also remain cautious of economic and policy changes that can impact sectoral outlook.
Smart Data Insight
Master the Perfect Entry & Exit for this Stock
Don't leave your profits to chance. Historically, this stock follows specific seasonal patterns that institutional traders use to maximize returns.
- ✅ Identify the "Golden Buying Window"
- ✅ Avoid high-risk correction cycles
- ✅ Backtested data from the last 20+ years