
June 18, 2026 a 03:11 pm


Financial Stocks - Performance Analysis
📊 This analysis delves into the recent performance of leading financial stocks over three distinct timeframes: one week, one month, and three months. Observing the trends and fluctuations in these timeframes, we identify the top performers and underperformers within the sector. Through detailed examination, strategic insights into financial stocks are derived, guiding potential investment decisions.
Financial Stocks Performance One Week
🔍 Over the past week, financial stocks like AXP and JPM have demonstrated remarkable gains, with AXP leading at 6.77%. JPM and GS have also shown considerable strength. In contrast, PGR lags with the smallest gain in this period. The data suggests a trend of robust performance among the leading banks and asset managers.
| Stock | Performance (%) | Performance |
|---|---|---|
| AXP | 6.77 | |
| JPM | 6.28 | |
| GS | 6.01 |
Financial Stocks Performance One Month
🔍 In the one-month horizon, GS emerges as a significant top performer with a 17.52% gain. This performance is complemented by solid returns from JPM and WFC. However, MA showed a decline, standing at -1.15%. Overall, most stocks advanced, indicating a bullish outlook for major financial institutions.
| Stock | Performance (%) | Performance |
|---|---|---|
| GS | 17.52 | |
| JPM | 12.30 | |
| WFC | 11.93 |
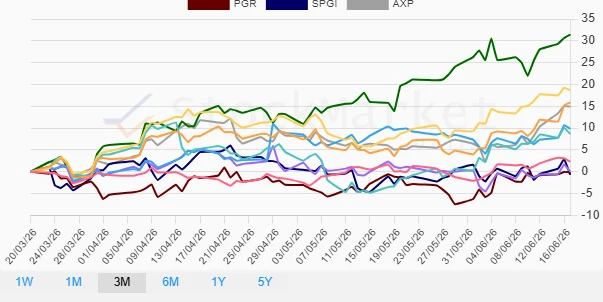
Financial Stocks Performance Three Months
🔍 A comprehensive view over the past three months reveals that GS outperformed all others with a stellar 31.44% increase, highlighting strong growth. BAC and JPM follow with robust gains, while SPGI showed a decline. This period reflects significant sector-wide growth, with banks as frontrunners.
| Stock | Performance (%) | Performance |
|---|---|---|
| GS | 31.44 | |
| BAC | 18.69 | |
| JPM | 15.88 |
Summary
💡 The analysis of financial stocks over these periods reveals a dominant positive trajectory, particularly influenced by leading banks and financial institutions. The recent strong performances of GS, JPM, and AXP signify robust underlying fundamentals within the sector. This suggests an optimistic outlook for stakeholders, especially in a recovering economic environment.
Smart Data Insight
Master the Perfect Entry & Exit for this Stock
Don't leave your profits to chance. Historically, this stock follows specific seasonal patterns that institutional traders use to maximize returns.
- ✅ Identify the "Golden Buying Window"
- ✅ Avoid high-risk correction cycles
- ✅ Backtested data from the last 20+ years