
July 16, 2026 a 03:12 pm


Financial Stocks - Performance Analysis
📊 The financial sector has showcased diverse performance metrics over the short, medium, and long-term horizons, as evidenced by this detailed analysis. Our findings indicate that while certain stocks have demonstrated resilience and substantial growth, others have faced significant headwinds. This nuanced landscape of financial equities demands a strategic approach to asset allocation.
Financial Stocks Performance One Week
| Stock | Performance (%) | Performance |
|---|---|---|
| GS | 9.11% | |
| BAC | 3.91% | |
| JPM | 3.39% | |
| AXP | 3.34% | |
| SPGI | 2.65% | |
| MA | 2.30% | |
| VISA | 2.01% | |
| WFC | 0.77% | |
| BRK.B | -1.43% | |
| PGR | -10.65% |
🔥 An impressive performance by Goldman Sachs (GS) over the week with a 9.11% increase, while Progressive Corp (PGR) underperformed significantly at -10.65%.
Financial Stocks Performance One Month
| Stock | Performance (%) | Performance |
|---|---|---|
| BAC | 8.20% | |
| MA | 6.76% | |
| VISA | 6.59% | |
| JPM | 4.81% | |
| AXP | 5.29% | |
| GS | 6.11% | |
| WFC | 3.13% | |
| SPGI | 3.01% | |
| PGR | 1.17% | |
| BRK.B | -1.25% |
📈 Over the month, Bank of America (BAC) took the lead with a notable 8.20% rise, displaying robust investor confidence.
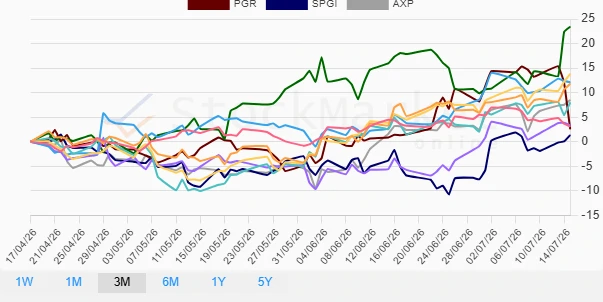
Financial Stocks Performance Three Months
| Stock | Performance (%) | Performance |
|---|---|---|
| GS | 23.41% | |
| BAC | 13.83% | |
| VISA | 12.14% | |
| JPM | 11.80% | |
| AXP | 8.49% | |
| WFC | 8.00% | |
| MA | 3.35% | |
| BRK.B | 3.10% | |
| PGR | 2.59% | |
| SPGI | 1.35% |
🔍 With an outstanding 23.41% rise over three months, Goldman Sachs (GS) leads, signaling strong strategic moves within the firm.
Summary
✅ The financial sector has shown a heterogeneous performance landscape. Notably, Goldman Sachs (GS) consistently appears as a top performer across all timeframes, reflecting its robust operational strategies. Conversely, Progressive Corp (PGR) faces challenges, particularly in the weekly metrics. Overall, investor confidence remains high for major financial institutions, but strategic diversification is recommended to mitigate potential risks associated with individual stock volatility.
Smart Data Insight
Master the Perfect Entry & Exit for this Stock
Don't leave your profits to chance. Historically, this stock follows specific seasonal patterns that institutional traders use to maximize returns.
- ✅ Identify the "Golden Buying Window"
- ✅ Avoid high-risk correction cycles
- ✅ Backtested data from the last 20+ years