May 14, 2026 a 03:12 pm


Financial Stocks - Performance Analysis
The financial sector has shown mixed results over different timeframes with notable variances in performance metrics. Short-term fluctuations highlight the market's vulnerability to external economic factors, while certain stocks exhibit longer-term resilience. This analysis identifies top performers and underperformers, providing insights for strategic investment decisions.
📊 Financial Stocks Performance One Week
| Stock | Performance (%) | Performance |
|---|---|---|
| GS | 3.16% | |
| BRK.B | 2.19% | |
| PGR | 0.14% | |
| VISA | -0.27% | |
| MA | -2.05% | |
| JPM | -1.95% | |
| AXP | -2.86% | |
| SPGI | -5.19% | |
| BAC | -5.61% | |
| WFC | -7.19% |
Over the one-week period, Goldman Sachs (GS) leads with a notable +3.16%, marking a positive market perception. Meanwhile, Wells Fargo (WFC) sustains the most significant drop at -7.19%, indicating caution due to potential systemic impacts or negative corporate developments.
🔍 Financial Stocks Performance One Month
| Stock | Performance (%) | Performance |
|---|---|---|
| GS | 5.16% | |
| VISA | 3.26% | |
| BRK.B | 1.74% | |
| PGR | -0.17% | |
| JPM | -3.36% | |
| MA | -4.21% | |
| SPGI | -4.29% | |
| AXP | -5.21% | |
| BAC | -6.62% | |
| WFC | -10.23% |
Goldman Sachs (GS) continues to dominate with a +5.16% gain over the month, reinforcing its strength amidst turbulent conditions. In contrast, Wells Fargo (WFC) experiences significant declines, down -10.23%, suggesting ongoing weaknesses or strategic missteps.
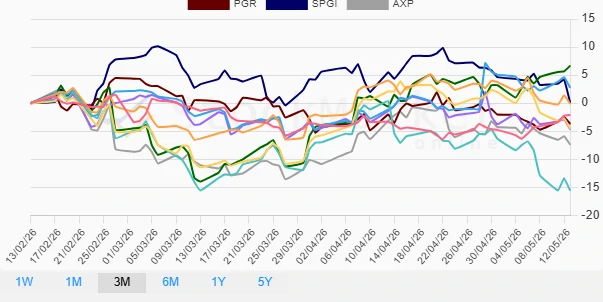
📈 Financial Stocks Performance Three Months
| Stock | Performance (%) | Performance |
|---|---|---|
| GS | 6.67% | |
| VISA | 2.76% | |
| SPGI | 0.08% | |
| JPM | -0.13% | |
| BRK.B | -2.11% | |
| PGR | -3.69% | |
| BAC | -4.54% | |
| MA | -4.67% | |
| AXP | -7.39% | |
| WFC | -15.58% |
Over the three months, again, Goldman Sachs (GS) takes the lead at +6.67%, signaling robust investor confidence. In stark contrast, Wells Fargo (WFC) continues its downward spiral with a -15.58% decline, possibly underscoring structural issues.
💡 Summary
This analysis unveils a profound disparity in stock performance within the financial sector. Goldman Sachs (GS) stands out as a consistent top performer, showcasing strong market adaptability, whereas Wells Fargo (WFC) struggles significantly, likely due to internal challenges or external pressures. Investors should tread cautiously, focusing on diversifying with stocks that demonstrate resilience and growth potential such as GS, while remaining vigilant about potential turnaround opportunities in struggling entities like WFC.
Smart Data Insight
Master the Perfect Entry & Exit for this Stock
Don't leave your profits to chance. Historically, this stock follows specific seasonal patterns that institutional traders use to maximize returns.
- ✅ Identify the "Golden Buying Window"
- ✅ Avoid high-risk correction cycles
- ✅ Backtested data from the last 20+ years