
August 14, 2025 a 03:12 pm

Financial Stocks - Performance Analysis
📊 The financial sector, known for its cyclical nature, has shown mixed performance across various timeframes. Overall, the recent week has displayed positive momentum, while the previous month has seen more volatility. Over a three-month trajectory, specific stocks have significantly outperformed or underperformed, reflecting both market fluctuations and company-specific dynamics.
Financial Stocks Performance One Week
📈 Over the course of the past week, financial stocks have largely demonstrated upward momentum. Bank of America (BAC) leads with a remarkable gain, alongside strong performances from American Express (AXP) and Goldman Sachs (GS). Companies such as SPGI, despite a minor increase, suggest broad sector confidence.
| Stock | Performance (%) | Performance |
|---|---|---|
| BAC | 5.11% | |
| AXP | 4.09% | |
| GS | 3.47% | |
| BRK.B | 3.40% | |
| VISA | 3.13% | |
| MA | 2.95% | |
| PGR | 1.61% | |
| JPM | 1.26% | |
| WFC | 1.15% | |
| SPGI | 0.62% |
Financial Stocks Performance One Month
🔍 Over the past month, Goldman Sachs and S&P Global Inc. have delivered the most substantial returns, rebounding strongly amid market shifts. Stocks like Visa and Wells Fargo reflect cautionary tales with slight declines, hinting at sector-specific challenges.
| Stock | Performance (%) | Performance |
|---|---|---|
| SPGI | 7.59% | |
| GS | 5.99% | |
| MA | 4.99% | |
| PGR | 3.01% | |
| BAC | 2.52% | |
| BRK.B | 1.61% | |
| JPM | 1.51% | |
| AXP | -1.03% | |
| WFC | -1.01% | |
| VISA | -1.19% |
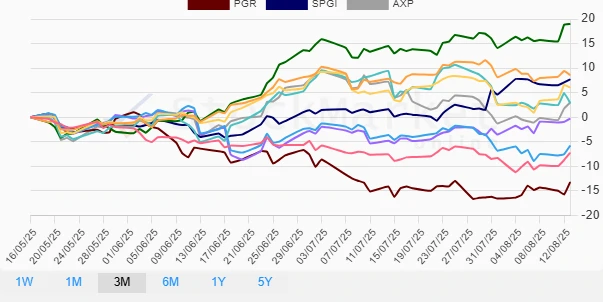
Financial Stocks Performance Three Months
❌ Over the last three months, the financial sector has faced notable volatility. Goldman Sachs has emerged as a top-performer, while the Progressive Corporation has suffered a substantial decline. Interestingly, JP Morgan and S&P Global showcase resilience amidst market fluctuations.
| Stock | Performance (%) | Performance |
|---|---|---|
| GS | 18.99% | |
| JPM | 8.60% | |
| SPGI | 7.71% | |
| BAC | 6.02% | |
| AXP | 2.99% | |
| WFC | 2.91% | |
| MA | -0.31% | |
| VISA | -5.80% | |
| BRK.B | -7.26% | |
| PGR | -13.21% |
Summary
💡 In conclusion, the financial sector's performance over the short and longer terms underscores varying company-specific fortunes amid broader economic conditions. High performers such as Goldman Sachs highlight opportunities amidst challenges, while laggards like Progressive signal cautionary trends. Investors are advised to consider these dynamics, keeping market conditions in perspective when making strategic allocations.
Smart Data Insight
Master the Perfect Entry & Exit for this Stock
Don't leave your profits to chance. Historically, this stock follows specific seasonal patterns that institutional traders use to maximize returns.
- ✅ Identify the "Golden Buying Window"
- ✅ Avoid high-risk correction cycles
- ✅ Backtested data from the last 20+ years