
August 13, 2026 a 03:12 pm


Financial Stocks - Performance Analysis
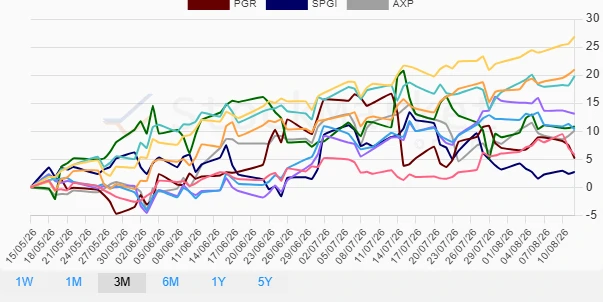
📊 Analyzing the performance trajectory of leading financial stocks over 1 Week, 1 Month, and 3 Months reveals varied trends and market reactions. Understanding these movements can aid investors in refining their investment strategies. In this analysis, we delve into which stocks have outperformed and underperformed across these time frames, offering insights into potential market directions and stock resilience.
Financial Stocks Performance One Week
| Stock | Performance (%) | Performance |
|---|---|---|
| BAC | 2.85 | |
| JPM | 2.47 | |
| WFC | 1.53 | |
| SPGI | 1.20 | |
| GS | 0.45 | |
| AXP | 0.45 | |
| BRK.B | -2.78 | |
| MA | -2.83 | |
| VISA | -3.00 | |
| PGR | -3.74 |
Financial Stocks Performance One Month
| Stock | Performance (%) | Performance |
|---|---|---|
| BAC | 6.79 | |
| JPM | 6.45 | |
| WFC | 4.38 | |
| MA | 4.16 | |
| BRK.B | 3.89 | |
| VISA | 1.09 | |
| AXP | -2.83 | |
| SPGI | -6.46 | |
| PGR | -8.15 | |
| GS | -8.88 |
Financial Stocks Performance Three Months
| Stock | Performance (%) | Performance |
|---|---|---|
| BAC | 26.86 | |
| JPM | 21.00 | |
| WFC | 19.83 | |
| MA | 13.10 | |
| GS | 10.83 | |
| VISA | 10.34 | |
| AXP | 10.13 | |
| BRK.B | 5.78 | |
| PGR | 5.15 | |
| SPGI | 2.76 |
Summary
💡 Over the past three months, Bank of America (BAC) demonstrated the most significant positive change with a robust 26.86% growth, highlighting the company's favorable market reception or some underlying solid financials. In contrast, during the one month period, Goldman Sachs (GS) experienced the most considerable decline, possibly due to earnings reports or macroeconomic factors impacting profit margins.
📈 The variance in stock performances across timeframes underscores the importance of monitoring market dynamics closely, providing a strategic advantage when identifying investment opportunities. Consistent performers like JPMorgan (JPM) highlight resilience, while scrutinizing underperformers may reveal market adverse conditions.
📉 Investors should remain vigilant of macro and microeconomic variables, leveraging historical performance but also staying abreast of upcoming trends or policy changes possibly influencing financial sector dynamics.
Smart Data Insight
Master the Perfect Entry & Exit for this Stock
Don't leave your profits to chance. Historically, this stock follows specific seasonal patterns that institutional traders use to maximize returns.
- ✅ Identify the "Golden Buying Window"
- ✅ Avoid high-risk correction cycles
- ✅ Backtested data from the last 20+ years