
November 12, 2026 a 03:12 pm


Financial Stocks - Performance Analysis
📊 A comprehensive examination of the top financial stocks over various timeframes reveals interesting dynamics. Volatility remains a considerable factor, with substantial differences between short and long-term performances. The financial sector displays a robust yet variable landscape, highlighting both opportunities and challenges for investors. This analysis will delve into the specific performances of these top stocks over the last week, month, and three months.
Financial Stocks Performance One Week
| Stock | Performance (%) | Performance |
|---|---|---|
| GS | 6.58% | |
| BRK.B | 2.76% | |
| BAC | 1.85% | |
| JPM | 1.82% | |
| WFC | 1.21% | |
| MA | 0.74% | |
| VISA | 0.69% | |
| SPGI | 0.58% | |
| PGR | 0.20% | |
| AXP | -0.56% |
Financial Stocks Performance One Month
| Stock | Performance (%) | Performance |
|---|---|---|
| SPGI | 15.05% | |
| BRK.B | 12.40% | |
| MA | 9.17% | |
| VISA | 7.45% | |
| WFC | 6.34% | |
| PGR | 5.01% | |
| GS | 4.47% | |
| AXP | 4.45% | |
| JPM | 3.86% | |
| BAC | -5.92% |
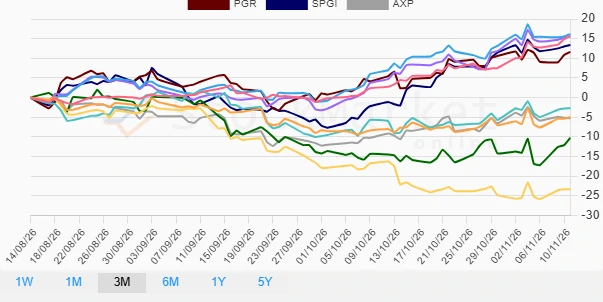
Financial Stocks Performance Three Months
| Stock | Performance (%) | Performance |
|---|---|---|
| VISA | 16.15% | |
| BRK.B | 15.73% | |
| MA | 15.49% | |
| SPGI | 13.38% | |
| PGR | 11.63% | |
| WFC | -2.73% | |
| AXP | -5.26% | |
| JPM | -4.98% | |
| GS | -10.27% | |
| BAC | -23.35% |
Summary
🔍 Observing the financial stocks over different time frames showcases a dynamic landscape. Short-term volatility is evident but certain stocks, like SPGI and VISA, maintain strong upward trends even across extended periods. This suggests robust resilience and growth potential. Stocks like BAC displayed significant underperformance, highlighting potential systemic issues or significant market pressures. As financial markets continue to fluctuate, investors may consider focusing on those stocks demonstrating consistent growth patterns while being cautious with those showing persistent downward trends. 💡 Strategic asset diversification within the financial sector can optimize both risk and return as market conditions evolve.
Smart Data Insight
Master the Perfect Entry & Exit for this Stock
Don't leave your profits to chance. Historically, this stock follows specific seasonal patterns that institutional traders use to maximize returns.
- ✅ Identify the "Golden Buying Window"
- ✅ Avoid high-risk correction cycles
- ✅ Backtested data from the last 20+ years