
June 11, 2026 a 03:12 pm

Financial Stocks - Performance Analysis
📊 The financial sector has exhibited notable fluctuations in recent weeks, driven by macroeconomic conditions, regulatory changes, and market sentiment. This timely analysis focuses on the performance of leading financial stocks over the past week, month, and quarter, identifying key trends and offering strategic insights.
Financial Stocks Performance One Week
🔍 Over the past week, Progressive Corporation (PGR) emerged as the standout performer, recording a remarkable increase of 4.55%. In contrast, Goldman Sachs (GS) faced significant challenges, suffering a pronounced decline of 8.55%. Mastercard (MA) and S&P Global Inc. (SPGI) also recorded positive performances, showcasing resilience amidst market volatility.
| Stock | Performance (%) | Performance |
|---|---|---|
| PGR | 4.55 | |
| MA | 1.56 | |
| SPGI | 1.52 | |
| VISA | 0.89 | |
| BRK.B | 1.07 | |
| BAC | 0.69 | |
| WFC | 0.43 | |
| AXP | 0.30 | |
| JPM | -0.55 | |
| GS | -8.55 |
Financial Stocks Performance One Month
🔍 The one-month period showcased Bank of America (BAC) and Wells Fargo (WFC) as dominant performers, with significant gains of 7.31% and 8.85% respectively. These results highlight a bullish sentiment towards major banking institutions. Conversely, Mastercard (MA) faced headwinds, declining by 1.93%, signaling potential sector-specific challenges.
| Stock | Performance (%) | Performance |
|---|---|---|
| WFC | 8.85 | |
| BAC | 7.31 | |
| GS | 6.32 | |
| PGR | 3.15 | |
| JPM | 1.59 | |
| SPGI | 0.82 | |
| AXP | -0.10 | |
| BRK.B | -0.19 | |
| VISA | -0.92 | |
| MA | -1.93 |
Financial Stocks Performance Three Months
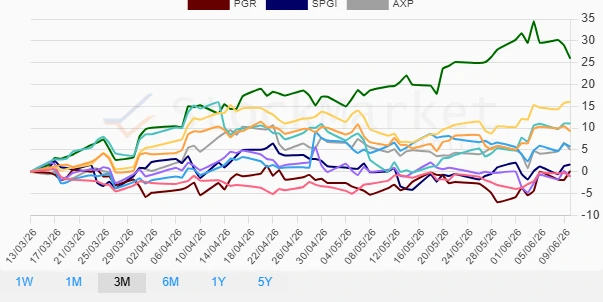
🔍 The three-month performance revealed a robust recovery and growth, particularly from Goldman Sachs (GS), which achieved an impressive 25.96% increase. Bank of America (BAC) similarly posted a strong gain of 16.02%, reflecting strategic growth initiatives and market confidence. Berkshire Hathaway (BRK.B) and Mastercard (MA), on the other hand, experienced minor setbacks.
| Stock | Performance (%) | Performance |
|---|---|---|
| GS | 25.96 | |
| BAC | 16.02 | |
| WFC | 11.03 | |
| JPM | 9.30 | |
| VISA | 5.77 | |
| AXP | 5.05 | |
| SPGI | 1.67 | |
| PGR | 0.17 | |
| MA | -1.05 | |
| BRK.B | -1.09 |
Summary
📈 The financial sector has demonstrated mixed results across varying timeframes, with substantial gains witnessed over the three-month period. Goldman Sachs stands out as a pivotal player with pronounced growth, underscoring strategic strength and market adaptability. As the financial landscape continues to evolve, these trends provide valuable insights for stakeholders. Investors should remain vigilant of market developments and consider diversification to optimize returns.
Smart Data Insight
Master the Perfect Entry & Exit for this Stock
Don't leave your profits to chance. Historically, this stock follows specific seasonal patterns that institutional traders use to maximize returns.
- ✅ Identify the "Golden Buying Window"
- ✅ Avoid high-risk correction cycles
- ✅ Backtested data from the last 20+ years